April 2026 Central Texas Housing Market Report
Central Texas Housing Market Gains Momentum as Buyers Reenter This Spring
The Central Texas housing market picked up meaningful momentum in April, and the latest data suggests that buyers who spent much of the past two years waiting for the right conditions are beginning to move with more confidence.
According to the April 2026 Central Texas Housing Report released by Unlock MLS, pending sales climbed 15.4% year over year to 3,411 transactions, while closed sales increased 2.0% year over year to 2,648 sales across the Austin-Round Rock-San Marcos MSA.
That combination matters.
Pending sales are one of the strongest forward-looking indicators in real estate because they show where buyer demand is heading—not just where it’s been. And right now, the signal is clear: when affordability improves, even temporarily, buyers are willing to act.
This spring’s momentum appears to have been driven in large part by the brief dip in mortgage rates earlier this year. Buyers who had been sitting on the sidelines waiting for better conditions saw an opening and moved quickly.
Vaike O’Grady, market research advisor at Unlock MLS, pointed directly to that shift in behavior:
“What stands out in April’s data is the shift in buyer psychology and overall market momentum. Many buyers who had been delaying their home search took advantage of the temporary dip in mortgage rates we saw earlier this year and moved quickly once conditions became more manageable. That activity is now showing up in both pending and closed sales data. Buyers are stepping back into the market with more urgency, especially when homes are priced correctly, and pending sales continue to be one of the clearest indicators of where the market is heading. April’s numbers show that confidence is building despite higher borrowing costs and ongoing economic uncertainty.”
That “buyer psychology” piece is important.
For much of the last couple of years, uncertainty kept many consumers frozen. Buyers questioned whether prices would fall further. Sellers hesitated to give up low interest rates. But markets eventually adapt—and what we’re seeing now is a growing number of buyers accepting the reality of today’s rate environment and focusing instead on long-term opportunity and affordability.
At the same time, correctly priced homes are continuing to stand out.
This is no longer a market where simply listing a home guarantees activity. Buyers are more selective, more analytical, and more payment-conscious than they were during the frenzy years. But when pricing, presentation, and expectations align, homes are still moving.
John Crowe, 2026 Unlock MLS and ABoR president, emphasized that strong demand still exists beneath the surface—even with affordability challenges remaining front and center:
“In April, the rise in sales—both year-over-year and month-over-month—indicates that buyers are purchasing homes because it is a good investment. At the same time, affordability remains one of the biggest challenges facing Central Texas families. That’s why expanding housing supply at a variety of accessible price points remains so important. Reports like Unlock MLS’ and ABoR’s recent HOME Impact Report show that increasing housing options can help create more attainable pathways to homeownership across our region.”
The bigger takeaway from April is this: the market is becoming more active without becoming overheated.
That’s a healthy sign.
Inventory, pricing, and buyer demand are beginning to operate in a more sustainable rhythm, and the buyers stepping into the market today tend to be more intentional and financially prepared than we saw during the rapid-growth years.
As Central Texas moves deeper into the spring and summer selling season, the market appears to be entering a phase defined less by hype—and more by opportunity, strategy, and long-term confidence.
Austin-Round Rock-San Marcos MSA
April 2026 - For Sale
-
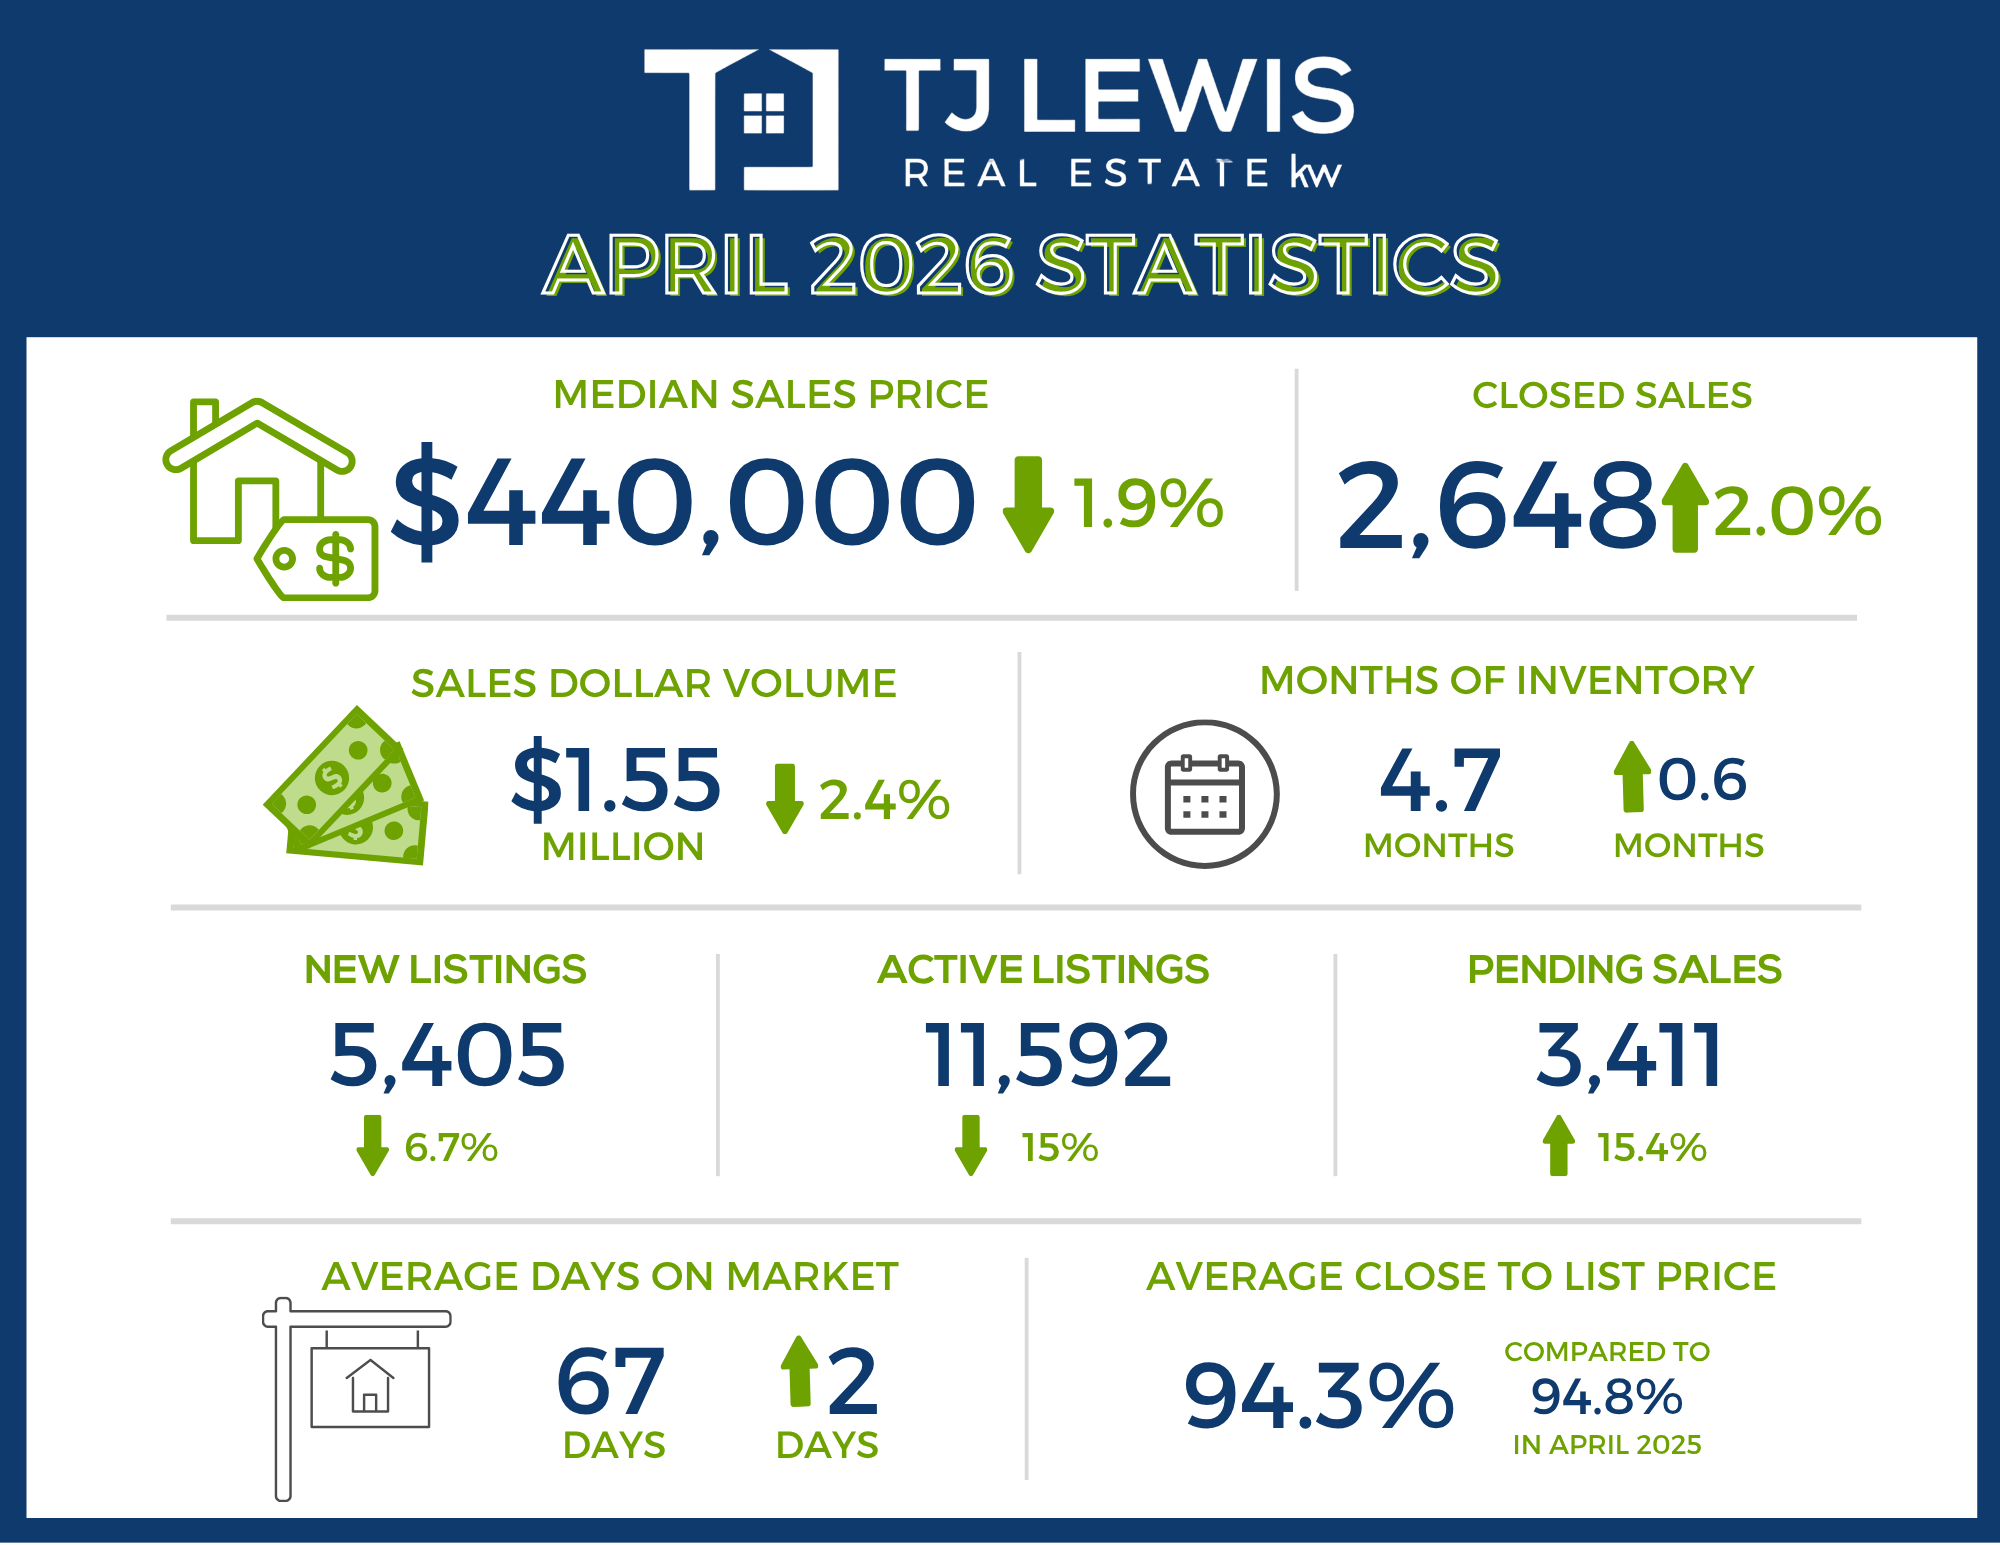
2,648 – Residential homes sold, 2.0% more than April 2025.
-
$440,000 – Median price for residential homes, 1.9% less than April 2025.
-
5,405 – New home listings on the market, 6.7% less than April 2025.
-
11,592 – Active home listings on the market, 15.0% less than April 2025.
-
3,411 – Pending sales, 15.4% more than April 2025.
-
4.7 – Months of inventory, 0.6 less than April 2025.
-
$1,554,376,535 – Total dollar volume of homes sold, 2.4% more than April 2025.
-
94.3% – Average close to list price, compared to 94.8% in April 2025.
April 2026 - For Lease
-
2,631 – Closed leases, 0.2% more than April 2025.
-
$2,100 – Median price for rent, 4.5% less than April 2025.
-
3,623 – New lease listings on the market, 1.1% less than April 2025.
-
3,810 – Active lease listings on the market, 7.3% less than April 2025.
-
3,185 – Pending sales, 12.9% more than April 2025.
-
1.8 – Months of inventory, flat compared to April 2025.
-
$6,214,492 – Total dollar volume of leases, 4.5% less than April 2025.
-
97.7% – Average close to list price, compared to 97.6% in April 2025.
City of Austin
April 2026 - For Sale
-
980 – Residential homes sold, 8.5% more than April 2025.
-
$573,750 – Median price for residential homes, 3.2% less than April 2025.
-
2,032 – New home listings on the market, 11.7% less than April 2025.
-
3,987 – Active home listings on the market, 24.3% less than April 2025.
-
1,219 – Pending sales, 20.0% more than April 2025.
-
4.5 – Months of inventory, 1.4 less than April 2025.
-
$748,006,685 – Total dollar volume of homes sold, 6.1% more than April 2025.
-
94.9% – Average close to list price, compared to 95.1% in April 2025.
April 2026 - For Lease
-
1,349 – Closed leases, 1.6% more than April 2025.
-
$2,150 – Median price for rent, 6.5% less than April 2025.
-
1,862 – New lease listings on the market, 1.6 less than April 2025.
-
1,975– Active lease listings on the market, 6.4% less than April 2025.
-
1,631 – Pending sales, 13.0% more than April 2025.
-
2.0 – Months of inventory, flat compared to April 2025.
-
$3,421,351 – Total dollar volume of leases, 4.3% less than April 2025.
-
97.5% – Average close to list price, compared to 97.4% in April 2025.
Travis County
April 2026 - For Sale
-
1,249 – Residential homes sold, 4.7% more than April 2025.
-
$505,000 – Median price for residential homes, 1.9% less than April 2025.
-
2,644 – New home listings on the market, 10.3% less than April 2025.
-
5,615 – Active home listings on the market, 19.0% less than April 2025.
-
1,566 – Pending sales, 20.4% more than April 2025.
-
4.8 – Months of inventory, 1.0 months less than April 2025.
-
$881,801,119 – Total dollar volume of homes sold, 4.8% more than April 2025.
-
94.6% – Average close to list price, compared to 95.0% in April 2025.
April 2026 - For Lease
-
1,540 – Closed leases, 1.5% more than April 2025.
-
$2,159 – Median price for rent, 6.1% less than April 2025.
-
2,131 – New lease listings on the market, 0.7% less than April 2025.
-
2,369 – Active lease listings on the market, 5.3% less than April 2025.
-
1,850 – Pending sales, 14.7% more than April 2025.
-
2.1 – Months of inventory, 0.1 months more than April 2025.
-
$3,901,556 – Total dollar volume of leases, 4.0% less than April 2025.
-
97.5% – Average close to list price, compared to 97.4% in April 2025.
Williamson County
April 2026 - For Sale
-
878 – Residential homes sold, 1.3% less than April 2025.
-
$412,490 – Median price for residential homes, 4.1% less than April 2025.
-
1,728 – New home listings on the market, 0.9% less than April 2025.
-
3,460 – Active home listings on the market, 12.8% less than April 2025.
-
1,183 – Pending sales, 18.7% more than April 2025.
-
4.1 – Months of inventory, 0.4 months less than April 2025.
-
$423,180,384 – Total dollar volume of homes sold, 2.5% less than April 2025.
-
94.7% – Average close to list price, compared to 95.0% in April 2025.
April 2026 - For Lease
-
811 – Closed leases, 2.1% less than April 2025.
-
$2,095 – Median price for rent, 2.6% less than April 2025.
-
1,101 – New lease listings on the market, 1.4% less than April 2025.
-
941 – Active lease listings on the market, 19.4% less than April 2025.
-
962 – Pending sales, 7.2% more than April 2025.
-
1.3 – Months of inventory, 0.2 months less than April 2025.
-
$1,737,776 – Total dollar volume of leases, 5.9% less than April 2025.
-
98.0% – Average close to list price, compared to 97.8% in April 2025.
Hays County
April 2026 - For Sale
-
350 – Residential homes sold, 3.0% less than April 2025.
-
$419,990 – Median price for residential homes, 8.8% more than April 2025.
-
699 – New home listings on the market, 10.0% less than April 2025.
-
1,601 – Active home listings on the market, 14.4% less than April 2025.
-
437 – Pending sales, 14.3% less than April 2025.
-
4.7 – Months of inventory, 0.6 months less than April 2025.
-
$183,236,211 – Total dollar volume of homes sold, 0.8% less than April 2025.
-
94.1% – Average close to list price, flat compared to April 2025.
April 2026 - For Lease
-
217 – Closed leases, flat compared to April 2025.
-
$1,971 – Median price for rent, 2.4% less than April 2025.
-
300 – New lease listings on the market, 2.3% less than April 2025.
-
351 – Active lease listings on the market, 3.8% more than April 2025.
-
281 – Pending sales, 16.6% more than April 2025.
-
2.0 – Months of inventory, 0.5 months more than April 2025.
-
$455,114 – Total dollar volume of leases, 3.6% less than April 2025.
-
97.5% – Average close to list price, compared to 98.3% in April 2025.
Bastrop County
April 2026 - For Sale
-
123 – Residential homes sold, 9.8% more than April 2025.
-
$350,000 – Median price for residential homes, 2.9% more than April 2025.
-
227 – New home listings on the market, 7.3% less than April 2025.
-
712 – Active home listings on the market, 2.0% more than April 2025.
-
163 – Pending sales, 45.5% more than April 2025.
-
7.3 – Months of inventory, 0.1 months more than April 2025.
-
$50,227,818 – Total dollar volume of homes sold, 9.5% more than April 2025.
-
91.1% – Average close to list price, compared to 93.0% in April 2025.
April 2026 - For Lease
-
41 – Closed leases, 14.6% less than April 2025.
-
$1,950 – Median price for rent, 0.3% less than April 2025.
-
66 – New lease listings on the market, 9.6% less than April 2025.
-
108 – Active lease listings on the market, 42.1% more than April 2025.
-
63 – Pending sales, 21.2% more than April 2025.
-
3.5 – Months of inventory, 1.4 months more than April 2025.
-
$83,079 – Total dollar volume of leases, 11.4% less than April 2025.
-
98.3% – Average close to list price, compared to 96.8% in April 2025.
Caldwell County
April 2026 - For Sale
-
48 – Residential homes sold, 23.1% more than April 2025.
-
$262,994 – Median price for residential homes, 12.3% less than April 2025.
-
107 – New home listings on the market, 28.9% more than April 2025.
-
204 – Active home listings on the market, 12.1% more than April 2025.
-
62 – Pending sales, 72.2% more than April 2025.
-
6.0 – Months of inventory, 0.5 months more than April 2025.
-
$15,931,003– Total dollar volume of homes sold, 30.3% more than April 2025.
-
90.2% – Average close to list price, compared to 95.1% in April 2025.
April 2026 - For Lease
-
22 – Closed leases, 37.5% more than April 2025.
-
$1,695 – Median price for rent, 5.2% less than April 2025.
-
25 – New lease listings on the market, 13.6% more than April 2025.
-
41 – Active lease listings on the market, 46.4% more than April 2025.
-
29 – Pending sales, 61.1% more than April 2025.
-
2.1 – Months of inventory, 0.4 months more than April 2025.
-
$36,967 – Total dollar volume of leases, 38.9% more than April 2025.
-
95% – Average close to list price, compared to 96.8% in April 2025.
For more information or to download the April 2026 Central Texas Housing Market Report, visit UnlockMLS.com/Stats.
Recent Posts