February 2026 Central Texas Housing Market Report

As we move closer to the spring homebuying season, the Central Texas housing market is showing clear signs of renewed momentum. The latest data suggests that buyers who spent much of the past year waiting on the sidelines are beginning to reengage, and the balance between supply and demand is tightening in a healthy way.
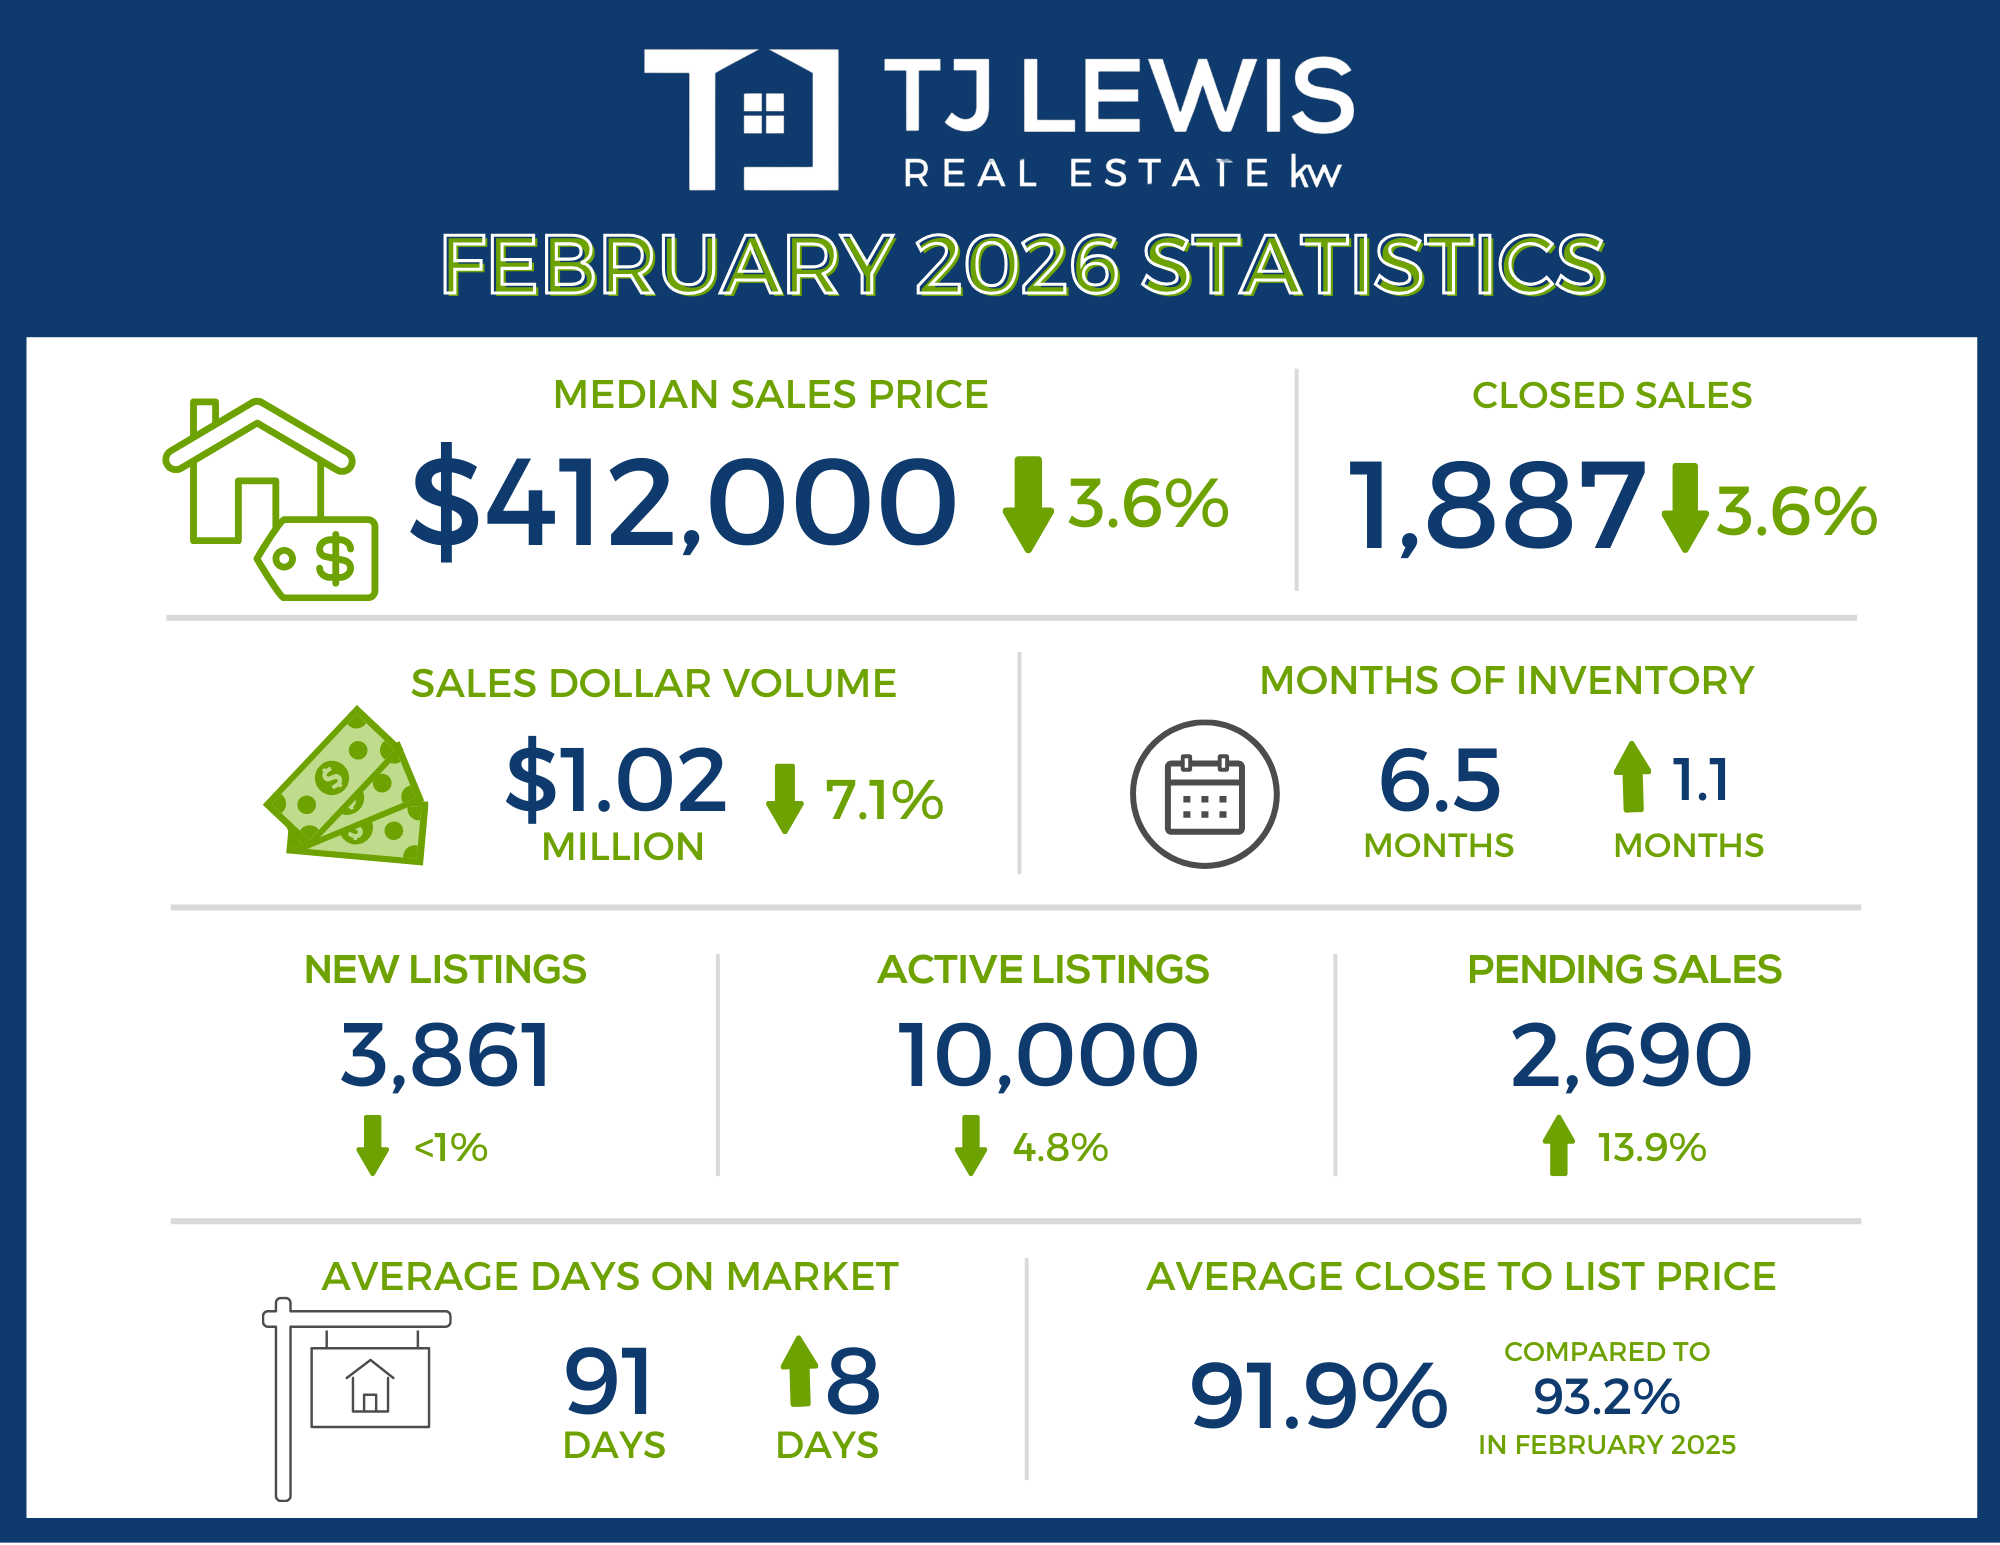
According to the February 2026 Central Texas Housing Report released by Unlock MLS, pending sales climbed to 2,690 transactions, up 13.9% year over year across the Austin-Round Rock-San Marcos MSA. That kind of increase this early in the year is an important signal of strengthening demand as we approach the most active part of the real estate calendar.
Another indicator of improving market alignment is the close-to-list price ratio, which rose from 90.6% in December to 92.0% in February. In practical terms, that means buyers and sellers are getting closer to meeting in the middle on pricing expectations—a key ingredient for smoother transactions and a more efficient market.
Vaike O’Grady, market research advisor at Unlock MLS, pointed to the shift in inventory levels as further evidence that buyer demand is picking up speed.
“The inventory count average was around 12,076 for the past two years, but in February, we saw active listings fall to 10,000 across the MSA, down 4.8% from a year ago. This tells us that sellers are returning to the market at roughly the same pace as last year, but buyers are coming back faster. These balanced market conditions have given buyers a chance to catch up. It’s a good sign that healthy momentum is fueling the market.”
This dynamic—buyers accelerating faster than new listings are entering the market—is one of the clearest signals that the market may be shifting out of the slower pace we saw through much of 2024 and early 2025.
John Crowe, president of the 2026 Unlock MLS and ABoR, emphasized that many buyers have spent the last year trying to read the market before making their move.
“A lot of buyers have spent the past year watching and waiting, wondering if prices would keep falling or if they should hold out longer. What we’re seeing now is that market conditions are increasingly favorable for more buyers to act. That’s where the Multiple Listing Service and working with a professional agent need to go hand in hand. Unlock MLS gives agents the most current and comprehensive view of the market, so clients aren’t making decisions based on headlines but on real data and professional market expertise.”
What stands out in the February data is not just the increase in activity, but the way the market is behaving. The extreme swings we saw during the pandemic years are gone. Instead, Central Texas is moving into a more balanced phase—where supply, pricing, and demand are interacting in a way that feels sustainable.
If this momentum continues into the spring months, 2026 could shape up to be a year when buyers and sellers alike find a more predictable, strategic environment for making real estate decisions.
Austin-Round Rock-San Marcos MSA
February 2026 - For Sale
-
1,887 – Residential homes sold, 3.6% less than February 2025.
-
$412,000 – Median price for residential homes, 3.6% less than February 2025.
-
3,861 – New home listings on the market, 0.8% less than February 2025.
-
10,000 – Active home listings on the market, 4.8% less than February 2025.
-
2,690 – Pending sales, 13.9% more than February 2025.
-
6.5 – Months of inventory, 1.1 more than February 2025.
-
$1,022,593,378 – Total dollar volume of homes sold, 7.1% less than February 2025.
-
91.9% – Average close to list price, compared to 93.2% in February 2025.
February 2026 - For Lease
-
2,304 – Closed leases, 4.2% more than February 2025.
-
$2,000 – Median price for rent, 4.8% less than February 2025.
-
2,913 – New lease listings on the market, 18.1% more than February 2025.
-
6,447 – Active lease listings on the market, 59.6% more than February 2025.
-
2,639 – Pending sales, 16.9% more than February 2025.
-
2.8 – Months of inventory, 0.7 months more than February 2025.
-
$5,224,059 – Total dollar volume of leases, 0.4% less than February 2025.
-
96.2% – Average close to list price, flat compared to February 2025.
City of Austin
February 2026 - For Sale
-
664 – Residential homes sold, 4.7% less than February 2025.
-
$540,000 – Median price for residential homes, 2.7% less than February 2025.
-
1,399 – New home listings on the market, 3.8% less than February 2025.
-
3,148 – Active home listings on the market, 13.0% less than February 2025.
-
923 – Pending sales, 15.1% more than February 2025.
-
6.2 – Months of inventory, 1.0 more than February 2025.
-
$476,868,162 – Total dollar volume of homes sold, 7.8% less than February 2025.
-
92.1% – Average close to list price, compared to 92.9% in February 2025.
February 2026 - For Lease
-
1,184 – Closed leases, 11.2% more than February 2025.
-
$2,100 – Median price for rent, 5.6% less than February 2025.
-
1,556 – New lease listings on the market, 25.7% more than February 2025.
-
4,163 – Active lease listings on the market, 105.4% more than February 2025.
-
1,343 – Pending sales, 26.3% more than February 2025.
-
3.0 – Months of inventory, 0.6 months more than February 2025.
-
$2,878,921 – Total dollar volume of leases, 3.5% more than February 2025.
-
96.1% – Average close to list price, compared to 95.8% in February 2025.
Travis County
February 2026 - For Sale
-
843 – Residential homes sold, 4.5% less than February 2025.
-
$489,900 – Median price for residential homes, 2.0% less than February 2025.
-
1,930 – New home listings on the market, 2.4% more than February 2025.
-
4,513 – Active home listings on the market, 8.6% less than February 2025.
-
1,234 – Pending sales, 14.4% more than February 2025.
-
6.6 – Months of inventory, 1.0 months more than February 2025.
-
$564,564,716 – Total dollar volume of homes sold, 8.3% less than February 2025.
-
91.9% – Average close to list price, compared to 93.1% in February 2025.
February 2026 - For Lease
-
1,336 – Closed leases, 11.0% more than February 2025.
-
$2,096 – Median price for rent, 4.7% less than February 2025.
-
1,780 – New lease listings on the market, 26.6% more than February 2025.
-
4,163 – Active lease listings on the market, 74.0% more than February 2025.
-
1,505 – Pending sales, 23.7% more than February 2025.
-
3.0 – Months of inventory, 0.6 months more than February 2025.
-
$3,232,081 – Total dollar volume of leases, 4.5% more than February 2025.
-
96.1% – Average close to list price, compared to 96.0% in February 2025.
Williamson County
February 2026 - For Sale
-
663 – Residential homes sold, 1.8% less than February 2025.
-
$395,850 – Median price for residential homes, 5.4% less than February 2025.
-
1,141 – New home listings on the market, 5.5% less than February 2025.
-
3,109 – Active home listings on the market, 1.6% less than February 2025.
-
903 – Pending sales, 17.1% more than February 2025.
-
5.8 – Months of inventory, 1.1 months more than February 2025.
-
$300,184,245 – Total dollar volume of homes sold, 5.7% less than February 2025.
-
92.7% – Average close to list price, compared to 93.8% in February 2025.
February 2026 - For Lease
-
709 – Closed leases, 3.4% less than February 2025.
-
$2,000 – Median price for rent, 4.8% less than February 2025.
-
780 – New lease listings on the market, 2.1% more than February 2025.
-
1,582 – Active lease listings on the market, 37.2% more than February 2025.
-
853 – Pending sales, 13,0% more than February 2025.
-
2.3 – Months of inventory, 0.6 months more than February 2025.
-
$1,464,845 – Total dollar volume of leases, 7.7% less than February 2025.
-
96.6% – Average close to list price, compared to 96.4% in February 2025.
Hays County
February 2026 - For Sale
-
267 – Residential homes sold, 3.3% less than February 2025.
-
$355,000 – Median price for residential homes, 1.4% less than February 2025.
-
536 – New home listings on the market, 6.3% less than February 2025.
-
1,502 – Active home listings on the market, 9.2% less than February 2025.
-
375 – Pending sales, 5.0% more than February 2025.
-
6.4 – Months of inventory, 0.4 months more than February 2025.
-
$119,458,023 – Total dollar volume of homes sold, 1.7% less than February 2025.
-
91.7% – Average close to list price, compared to 92.6% February 2025.
February 2026 - For Lease
-
197 – Closed leases, 4.4% less than February 2025.
-
$1,950 – Median price for rent, 2.3% less than February 2025.
-
252 – New lease listings on the market, 16.1% more than February 2025.
-
489 – Active lease listings on the market, 23.2% more than February 2025.
-
221 – Pending sales, 0.9% more than February 2025.
-
2.8 – Months of inventory, flat compared to February 2025.
-
$418,906 – Total dollar volume of leases, 5.0% less than February 2025.
-
96.0% – Average close to list price, compared to 96.6% in February 2025.
Bastrop County
February 2026 - For Sale
-
83 – Residential homes sold, 11.7% less than February 2025.
-
$335,000 – Median price for residential homes, 4.9% less than February 2025.
-
194 – New home listings on the market, 11.5% more than February 2025.
-
688 – Active home listings on the market, 15.2% more than February 2025.
-
128 – Pending sales, 4.9% more than February 2025.
-
10.1 – Months of inventory, 3.2 months more than February 2025.
-
$30,794,664 – Total dollar volume of homes sold, 13.3% less than February 2025.
-
89.7% – Average close to list price, compared to 93.0% in February 2025.
February 2026 - For Lease
-
40 – Closed leases, 4.8% less than February 2025.
-
$1,850 – Median price for rent, 2.4% less than February 2025.
-
67 – New lease listings on the market, 34.0% more than February 2025.
-
133 – Active lease listings on the market, 98.5% more than February 2025.
-
40 – Pending sales, flat compared to February 2025.
-
2.6 – Months of inventory, 0.6 months more than February 2025.
-
$70,969– Total dollar volume of leases, 10.5% less than February 2025.
-
95.9% – Average close to list price, compared to 95.3% in February 2025.
Caldwell County
February 2026 - For Sale
-
31 – Residential homes sold, 6.9% more than February 2025.
-
$221,990 – Median price for residential homes, 23.5% less than February 2025.
-
60 – New home listings on the market, 9.1% more than February 2025.
-
188 – Active home listings on the market, 19.7% more than February 2025.
-
50 – Pending sales, 51.5% more than February 2025.
-
5.9 – Months of inventory, 3.5 months more than February 2025.
-
$7,591,730– Total dollar volume of homes sold, 16.2% less than February 2025.
-
82.9% – Average close to list price, compared to 91.8% in February 2025.
February 2026 - For Lease
-
22 – Closed leases, 15.4% less than February 2025.
-
$1,725 – Median price for rent, 4.2% less than February 2025.
-
34 – New lease listings on the market, 17.2% more than February 2025.
-
80 – Active lease listings on the market, 166.7% more than February 2025.
-
20 – Pending sales, 23.1% less than February 2025.
-
4.7 – Months of inventory, flat compared to February 2025.
-
$37,258– Total dollar volume of leases, 18.8% less than February 2025.
-
96.8% – Average close to list price, compared to 95.4% in February 2025.
For more information or to download the February 2026 Central Texas Housing Market Report, visit UnlockMLS.com/Stats.
Recent Posts