January 2026 Central Texas Housing Market Report
Central Texas Housing Market Opens 2026 with Strength Beneath the Surface
If you’re watching the Central Texas housing market closely, January’s numbers tell a clear story: this market isn’t overheating — it’s stabilizing, and buyer momentum is quietly building.
According to the January Central Texas Housing Report released by Unlock MLS, pending sales rose to 2,349 transactions, up 10.1% year over year and up more than 23% from December. That’s not a small bump. That’s meaningful movement heading into the spring season.
At the same time, months of inventory declined by nearly one month compared to last year, showing that demand is absorbing new supply as it comes to market. Active listings held relatively steady at 10,083 properties, and the median home price came in at $400,495, down 2.3% from January 2025.
Taken together, this isn’t a market in retreat. It’s a market recalibrating.
Buyers are re-engaging. Sellers are pricing more realistically. And supply and demand are beginning to interact in a way that feels more predictable — and healthier — than what we saw during the pandemic surge.
Vaike O’Grady, market research advisor at Unlock MLS, described it this way:
"What we're seeing now is a market that has moved out of an overheated phase and into one where supply, pricing and demand are interacting as expected. Instead of sharp year-over-year swings, inventory and pricing are moving within a consistent range, allowing the market to operate under more typical conditions. This kind of environment creates a more sustainable foundation for long-term growth across Central Texas."
That phrase — sustainable foundation — is key.
The extreme swings are gone. The urgency-driven pricing is gone. What we’re seeing now is normalization. And in real estate, normalization is a good thing.
John Crowe, 2026 Unlock MLS and ABoR president, reinforced that point by highlighting how strategy matters more than ever:
“Deals are still happening across Central Texas, but they’re taking more time and strategy to get across the finish line. Negotiations are more nuanced and pricing decisions matter more than they did in recent years. That’s where professional agents add real value by helping clients interpret the data, set realistic expectations and navigate transactions strategically as the market settles back into normal seasonal rhythms.”
That’s exactly what we’re experiencing on the ground.
Homes that are priced correctly are attracting serious buyers. Buyers who understand today’s rates and affordability realities are moving forward with intention. And negotiations are thoughtful — not frantic.
As we approach the heart of the spring season, the early signal is clear: demand hasn’t disappeared. It’s simply become more disciplined.
And that shift may be the healthiest thing to happen to the Central Texas housing market in years.
Austin-Round Rock-San Marcos MSA
January 2026 - For Sale
-
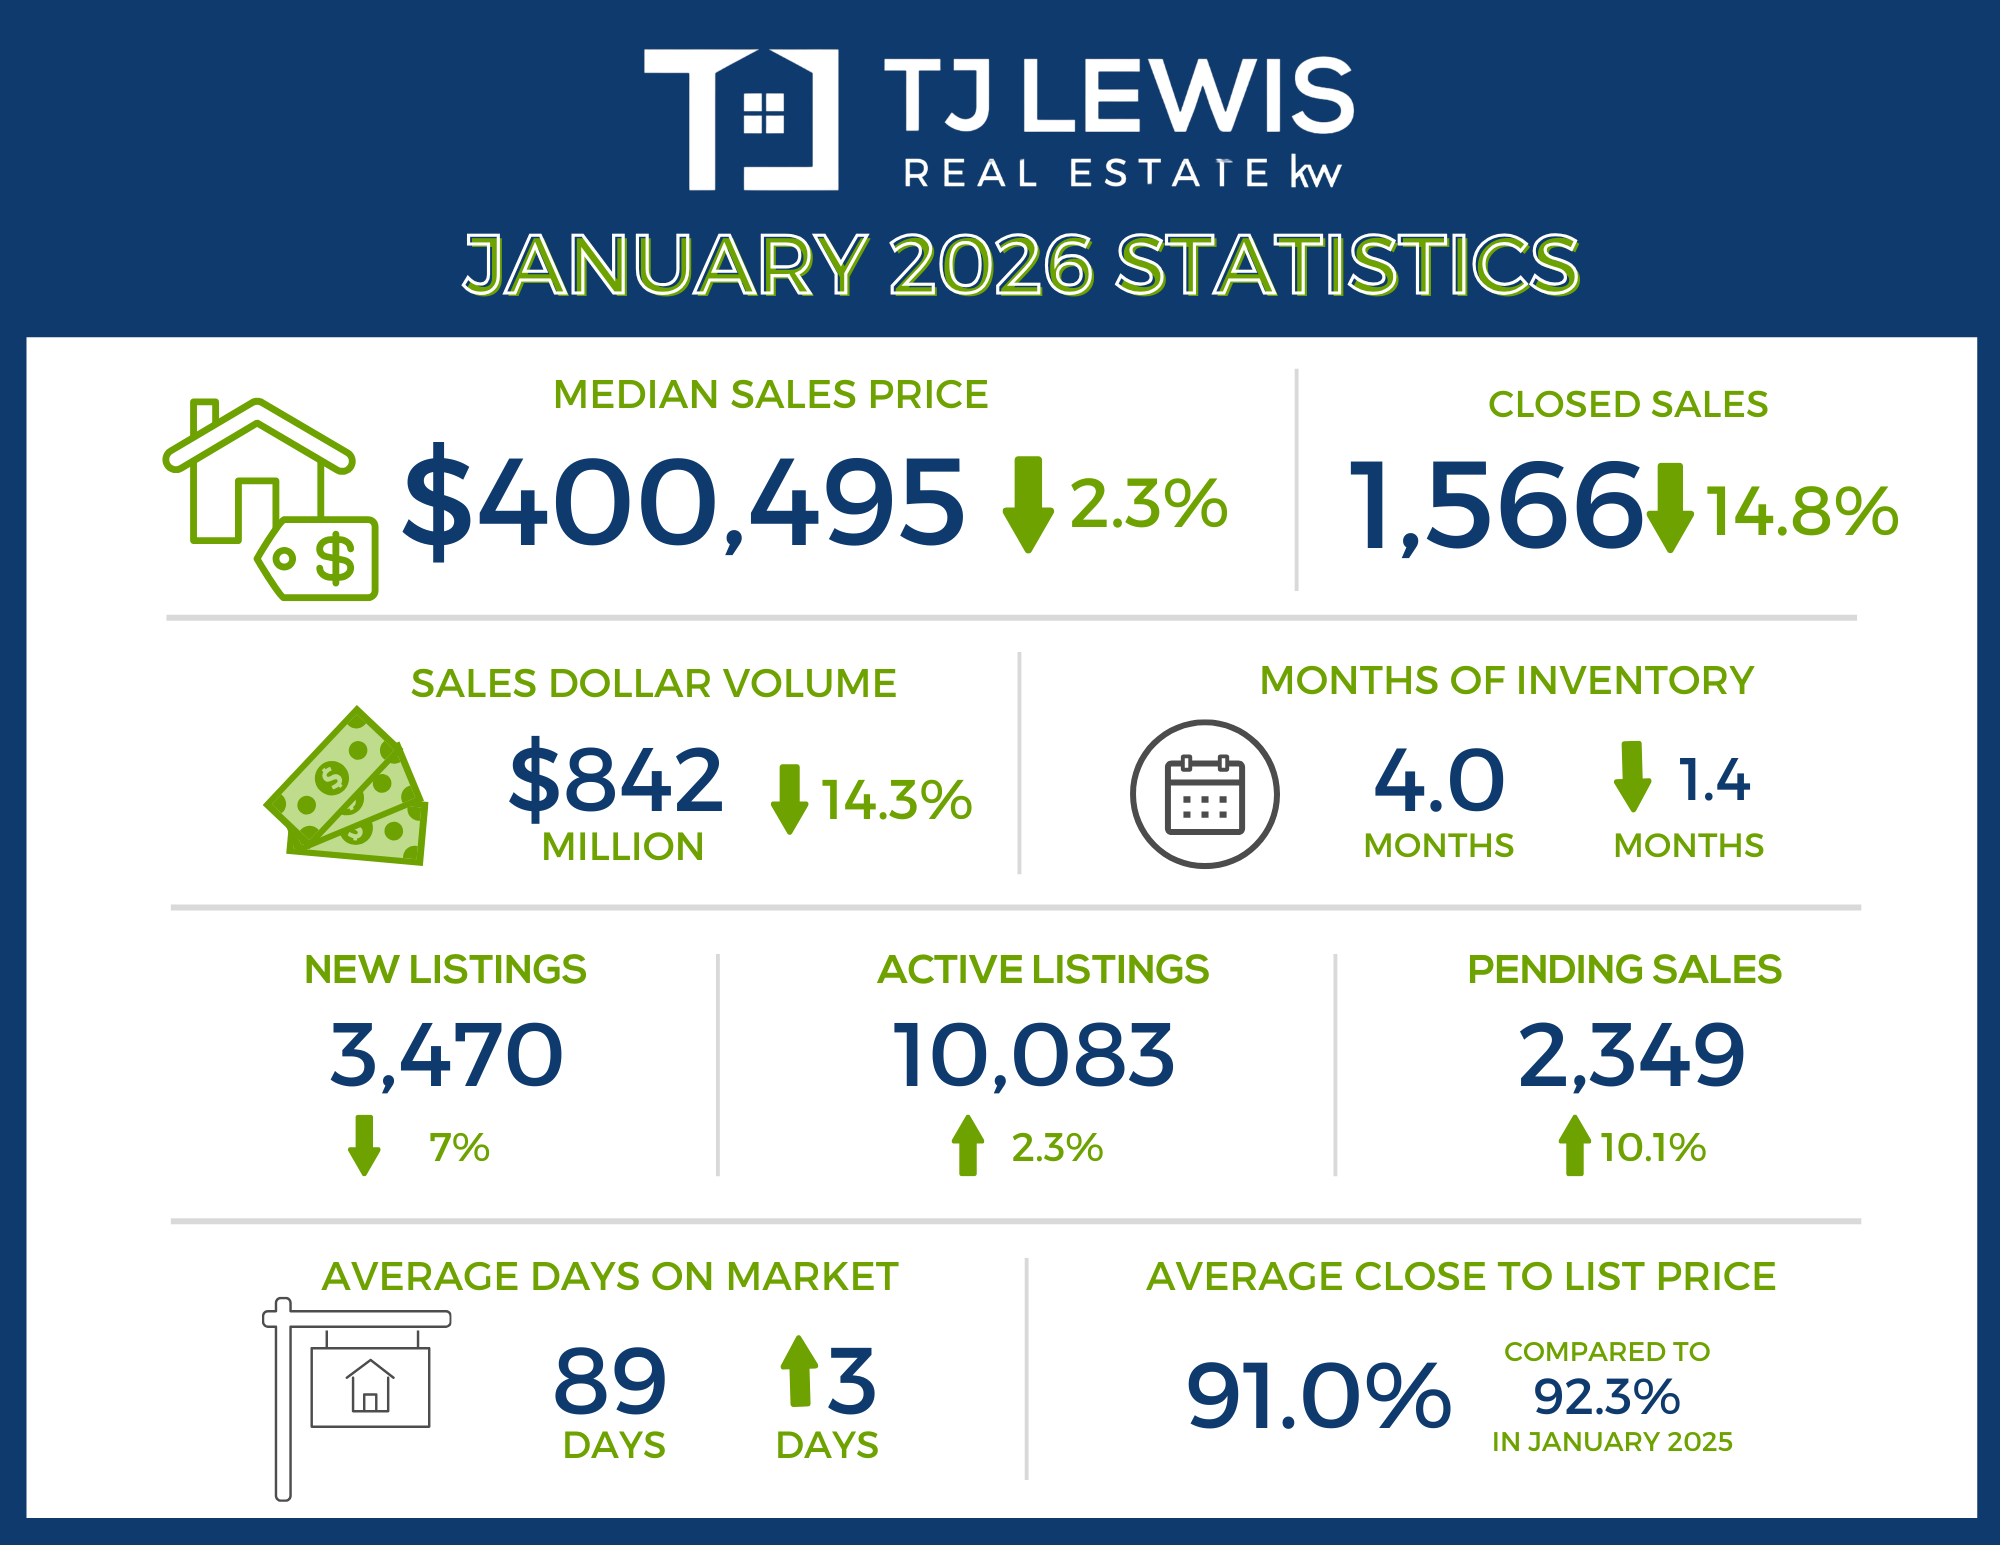
1,566 – Residential homes sold, 14.8% less than January 2025.
-
$400,495 – Median price for residential homes, 2.3% less than January 2025.
-
3,470 – New home listings on the market, 7.0% less than January 2025.
-
10,083 – Active home listings on the market, 2.3% more than January 2025.
-
2,349 – Pending sales, 10.1% more than January 2025.
-
4.0 – Months of inventory, 1.4 less than January 2025.
-
$842,125,277 – Total dollar volume of homes sold, 14.3% less than January 2025.
-
91% – Average close to list price, compared to 92.3% in January 2025.
January 2026 - For Lease
-
2,266 – Closed leases, 4.1% less than January 2025.
-
$2,000 – Median price for rent, 4.8% less than January 2025.
-
3,218 – New lease listings on the market, 11.1% more than January 2025.
-
6,486 – Active lease listings on the market, 47.3% more than January 2025.
-
2,674 – Pending sales, 4.3% more than January 2025.
-
3.5 – Months of inventory, 1.3 months more than January 2025.
-
$5,094,382 – Total dollar volume of leases, 7.9% less than January 2025.
-
95.5% – Average close to list price, compared to 95.3% in January 2025.
City of Austin
January 2026 - For Sale
-
509 – Residential homes sold, 8.8% less than January 2025.
-
$522,500 – Median price for residential homes, 5.0% less than January 2025.
-
1,169 – New home listings on the market, 12.0% less than January 2025.
-
3,262 – Active home listings on the market, 0.7% less than January 2025.
-
797 – Pending sales, 9.3% more than January 2025.
-
3.9 – Months of inventory, 2.0 less than January 2025.
-
$369,492,808 – Total dollar volume of homes sold, 9.4% less than January 2025.
-
90.8% – Average close to list price, compared to 91.3% in January 2025.
January 2026 - For Lease
-
1,211 – Closed leases, 1.8% less than January 2025.
-
$2,100 – Median price for rent, 4.5 less than January 2025.
-
1,852 – New lease listings on the market, 24.4% more than January 2025.
-
4,016 – Active lease listings on the market, 88.5% more than January 2025.
-
1,387 – Pending sales, 4.4% more than January 2025.
-
3.7 – Months of inventory, 1.4 months more than January 2025.
-
$2,857,711 – Total dollar volume of leases, 7.3% less than January 2025.
-
95.4% – Average close to list price, compared to 95.1% in January 2024.
Travis County
January 2026 - For Sale
-
684 – Residential homes sold, 12.4% less than January 2025.
-
$445,000 – Median price for residential homes, 6.3% less than January 2025.
-
1,624 – New home listings on the market, 9.6% less than January 2025.
-
4,462 – Active home listings on the market, 2.7% less than January 2025.
-
1,044 – Pending sales, 11.1% more than January 2025.
-
3.9 – Months of inventory, 2.0 months less than January 2025.
-
$450,898,391 – Total dollar volume of homes sold, 12.4% less than January 2025.
-
91.1% – Average close to list price, compared to 91.9% in January 2025.
January 2026 - For Lease
-
1,347 – Closed leases, 5.6% less than January 2025.
-
$2,100 – Median price for rent, 4.2% less than January 2025.
-
2,035 – New lease listings on the market, 22.5% more than January 2025.
-
4,016 – Active lease listings on the market, 59.0% more than January 2025.
-
1,544 – Pending sales, 1.4% more than January 2025.
-
3.7 – Months of inventory, 1.5 months more than January 2025.
-
$3,195,887 – Total dollar volume of leases, 9.5% less than January 2025.
-
95.5% – Average close to list price, compared to 95.2% in January 2025.
Williamson County
January 2026 - For Sale
-
536 – Residential homes sold, 16.1% less than January 2025.
-
$403,500 – Median price for residential homes, 0.4% less than January 2025.
-
1,063 – New home listings on the market, 4.1% less than January 2025.
-
3,091 – Active home listings on the market, 5.6% more than January 2025.
-
821 – Pending sales, 13.1% more than January 2025.
-
3.5 – Months of inventory, 1.1 months less than January 2025.
-
$246,944,325 – Total dollar volume of homes sold, 17.2% less than January 2025.
-
91.1% – Average close to list price, compared to 92.9% in January 2025.
January 2026 - For Lease
-
678 – Closed leases, 1.2% more than January 2025.
-
$1,995 – Median price for rent, 4.8% less than January 2025.
-
867 – New lease listings on the market, 2.8% less than January 2025.
-
1,726 – Active lease listings on the market, 32.2% more than January 2025.
-
827 – Pending sales, 8.8% more than January 2025.
-
3.0 – Months of inventory, 0.9 months more than January 2025.
-
$1,408,543 – Total dollar volume of leases, 2.9% less than January 2025.
-
95.5% – Average close to list price,compared to 95.7% in January 2025.
Hays County
January 2026 - For Sale
-
234 – Residential homes sold, 18.5% less than January 2025.
-
$344,500 – Median price for residential homes, 4.0% less than January 2025.
-
483 – New home listings on the market, 14.2% less than January 2025.
-
1,567 – Active home listings on the market, 1.3% less than January 2025.
-
347 – Pending sales, 9.1% more than January 2025.
-
4.4 – Months of inventory, 1.2 months less than January 2025.
-
$107,549,057 – Total dollar volume of homes sold, 12.3% less than January 2025.
-
92% – Average close to list price, flat compared to January 2025.
January 2026 - For Lease
-
172 – Closed leases, 14.4% less than January 2025.
-
$1,937 – Median price for rent, 0.7% less than January 2025.
-
221 – New lease listings on the market, 16.3% less than January 2025.
-
513 – Active lease listings on the market, 10.3% more than January 2025.
-
219 – Pending sales, 8.4% more than January 2025.
-
3.3 – Months of inventory, 3.3 months more than January 2025.
-
$363,498 – Total dollar volume of leases, 16.7% less than January 2025.
-
94.5% – Average close to list price, flat compared to January 2025.
Bastrop County
January 2026 - For Sale
-
77 – Residential homes sold, 20.6% less than January 2025.
-
$335,970 – Median price for residential homes, 2.9% less than January 2025.
-
225 – New home listings on the market, 15.4% more than January 2025.
-
711 – Active home listings on the market, 18.3% more than January 2025.
-
100 – Pending sales, 13.8% less than January 2025.
-
5.8 – Months of inventory, 0.9 months less than January 2025.
-
$27,279,673 – Total dollar volume of homes sold, 28.8% less than January 2025.
-
88.4% – Average close to list price, compared to 92.3% in January 2025.
January 2026 - For Lease
-
52 – Closed leases, 23.8% more than January 2025.
-
$1,860 – Median price for rent, 1.2% more than January 2025.
-
68 – New lease listings on the market, 21.4% more than January 2025.
-
150 – Active lease listings on the market, 108.3% more than January 2025.
-
60 – Pending sales, 13.2% more than January 2025.
-
3.1 – Months of inventory, 0.9 months more than January 2025.
-
$98,719– Total dollar volume of leases, 27.6% more than January 2025.
-
97.9% – Average close to list price, compared to 96.0% in January 2025.
Caldwell County
January 2026 - For Sale
-
35 – Residential homes sold, 6.1% more than January 2025.
-
$237,491 – Median price for residential homes, 17.0% less than January 2025.
-
75 – New home listings on the market, 11.9% more than January 2025.
-
252 – Active home listings on the market, 70.3% more than January 2025.
-
37 – Pending sales, 8.8% more than January 2025.
-
8.4 – Months of inventory, 3.5 months more than January 2025.
-
$9,453,831 – Total dollar volume of homes sold, 1.1% more than January 2025.
-
84.8% – Average close to list price, compared to 92.7% in January 2025.
January 2026 - For Lease
-
17 – Closed leases, 22.7% less than January 2025.
-
$1,750 – Median price for rent, 2.8% less than January 2025.
-
27 – New lease listings on the market, 17.4% more than January 2025.
-
81 – Active lease listings on the market, 138.2% more than January 2025.
-
24 – Pending sales, 4.0% less than January 2025.
-
4.3 – Months of inventory, 4.3 months more than January 2025.
-
$27,735– Total dollar volume of leases, 22.3% less than January 2025.
-
98.2% – Average close to list price, compared to 97.4% in January 2025.
For more information or to download the January 2026 Central Texas Housing Market Report, visit UnlockMLS.com/Stats.
Recent Posts