June 2026 Central Texas Housing Market Report
Mid-Year Market Update: Central Texas Housing Continues to Build Momentum
Six months into 2026, one thing has become increasingly clear: the Central Texas housing market has found its footing.
After several years of adjustment, the first half of this year has been defined by something we haven't seen in a while—consistent, sustainable growth. Buyers are returning, homes are selling, and the market is beginning to outperform many of the national trends dominating the headlines.
According to the June and Mid-Year 2026 Central Texas Housing Report released by Unlock MLS, year-to-date closed home sales increased 4.8% to 15,698 sales across the Austin-Round Rock-San Marcos MSA. If that pace continues through the second half of the year, Central Texas could post its first year of positive home sales growth in several years.
That's a meaningful shift.
Not because the market is suddenly booming again, but because it suggests buyers are becoming more comfortable with today's interest rates and are making decisions based on their long-term goals instead of waiting for the "perfect" market.
June's numbers reinforce that trend.
The median price year-to-date dipped slightly 2.4% to $425,000, while closed sales increased 0.6% in June to 2,961 sales compared to last year. Even more encouraging, pending sales rose 13.2% to 2,994 sales.
Pending sales are often one of the best indicators of future market activity because they reflect buyers who have already made the decision to move forward. When pending sales continue to outpace prior years, it's a strong indication that buyer confidence is growing—not fading.
Vaike O'Grady, market research advisor at Unlock MLS, said that's exactly what the latest data is showing.
“One of the strongest metrics that we continue to see is the growth in pending sales year-to-date. Pending sales provide us with an early look at where the market is headed, and when they're increasing alongside closed sales, it tells us buyers continue to move forward with confidence. This combination of transactions and moderating prices reflects a market that is creating opportunity for buyers, while sellers continue to find success by pricing and positioning their homes strategically for today's market.”
That balance between opportunity and strategy has become the defining characteristic of today's market.
Buyers have more choices than they did just a few years ago, while sellers who understand current market conditions are still achieving strong results. The days of simply putting a sign in the yard and expecting multiple offers overnight are largely behind us—but so are the fears that the market was headed for a prolonged slowdown.
O'Grady also pointed to several encouraging trends that emerged in June.
“In June, we saw inventory tighten, homes sell more quickly and median prices increase year-over-year. While we'll need to continue to monitor these trends in the months ahead, these early signals suggest the market is continuing to build on the progress we've seen over the past year.”
Taken together, those are exactly the kinds of indicators you'd expect to see in a healthy housing market.
Inventory is no longer expanding rapidly. Buyers are making decisions more confidently. Sellers are adjusting expectations. And homes that are priced appropriately continue to attract strong interest.
John Crowe, 2026 Unlock MLS and ABoR president, emphasized that local expertise has become more valuable as the market has become more balanced.
“The first half of the year demonstrates that today's market is creating opportunities on both sides of the transaction. Every market is local, and conditions can vary from one neighborhood to the next. That's why working with a professional agent, who has access to market intelligence through Unlock MLS, gives buyers and sellers the local insights needed to price strategically, understand real-time market trends and negotiate with confidence.”
The biggest takeaway from the first half of 2026 isn't that the market has returned to the frenzy of a few years ago. It's that we've entered something much healthier.
Buyer demand continues to strengthen. Inventory is moving toward equilibrium. Prices have become more sustainable. And both buyers and sellers have the ability to make thoughtful, informed decisions without feeling rushed.
If these trends continue through the second half of the year, 2026 may be remembered not as the year the market rebounded—but as the year it fully stabilized.
Austin-Round Rock-San Marcos MSA
June 2026 Sales
-
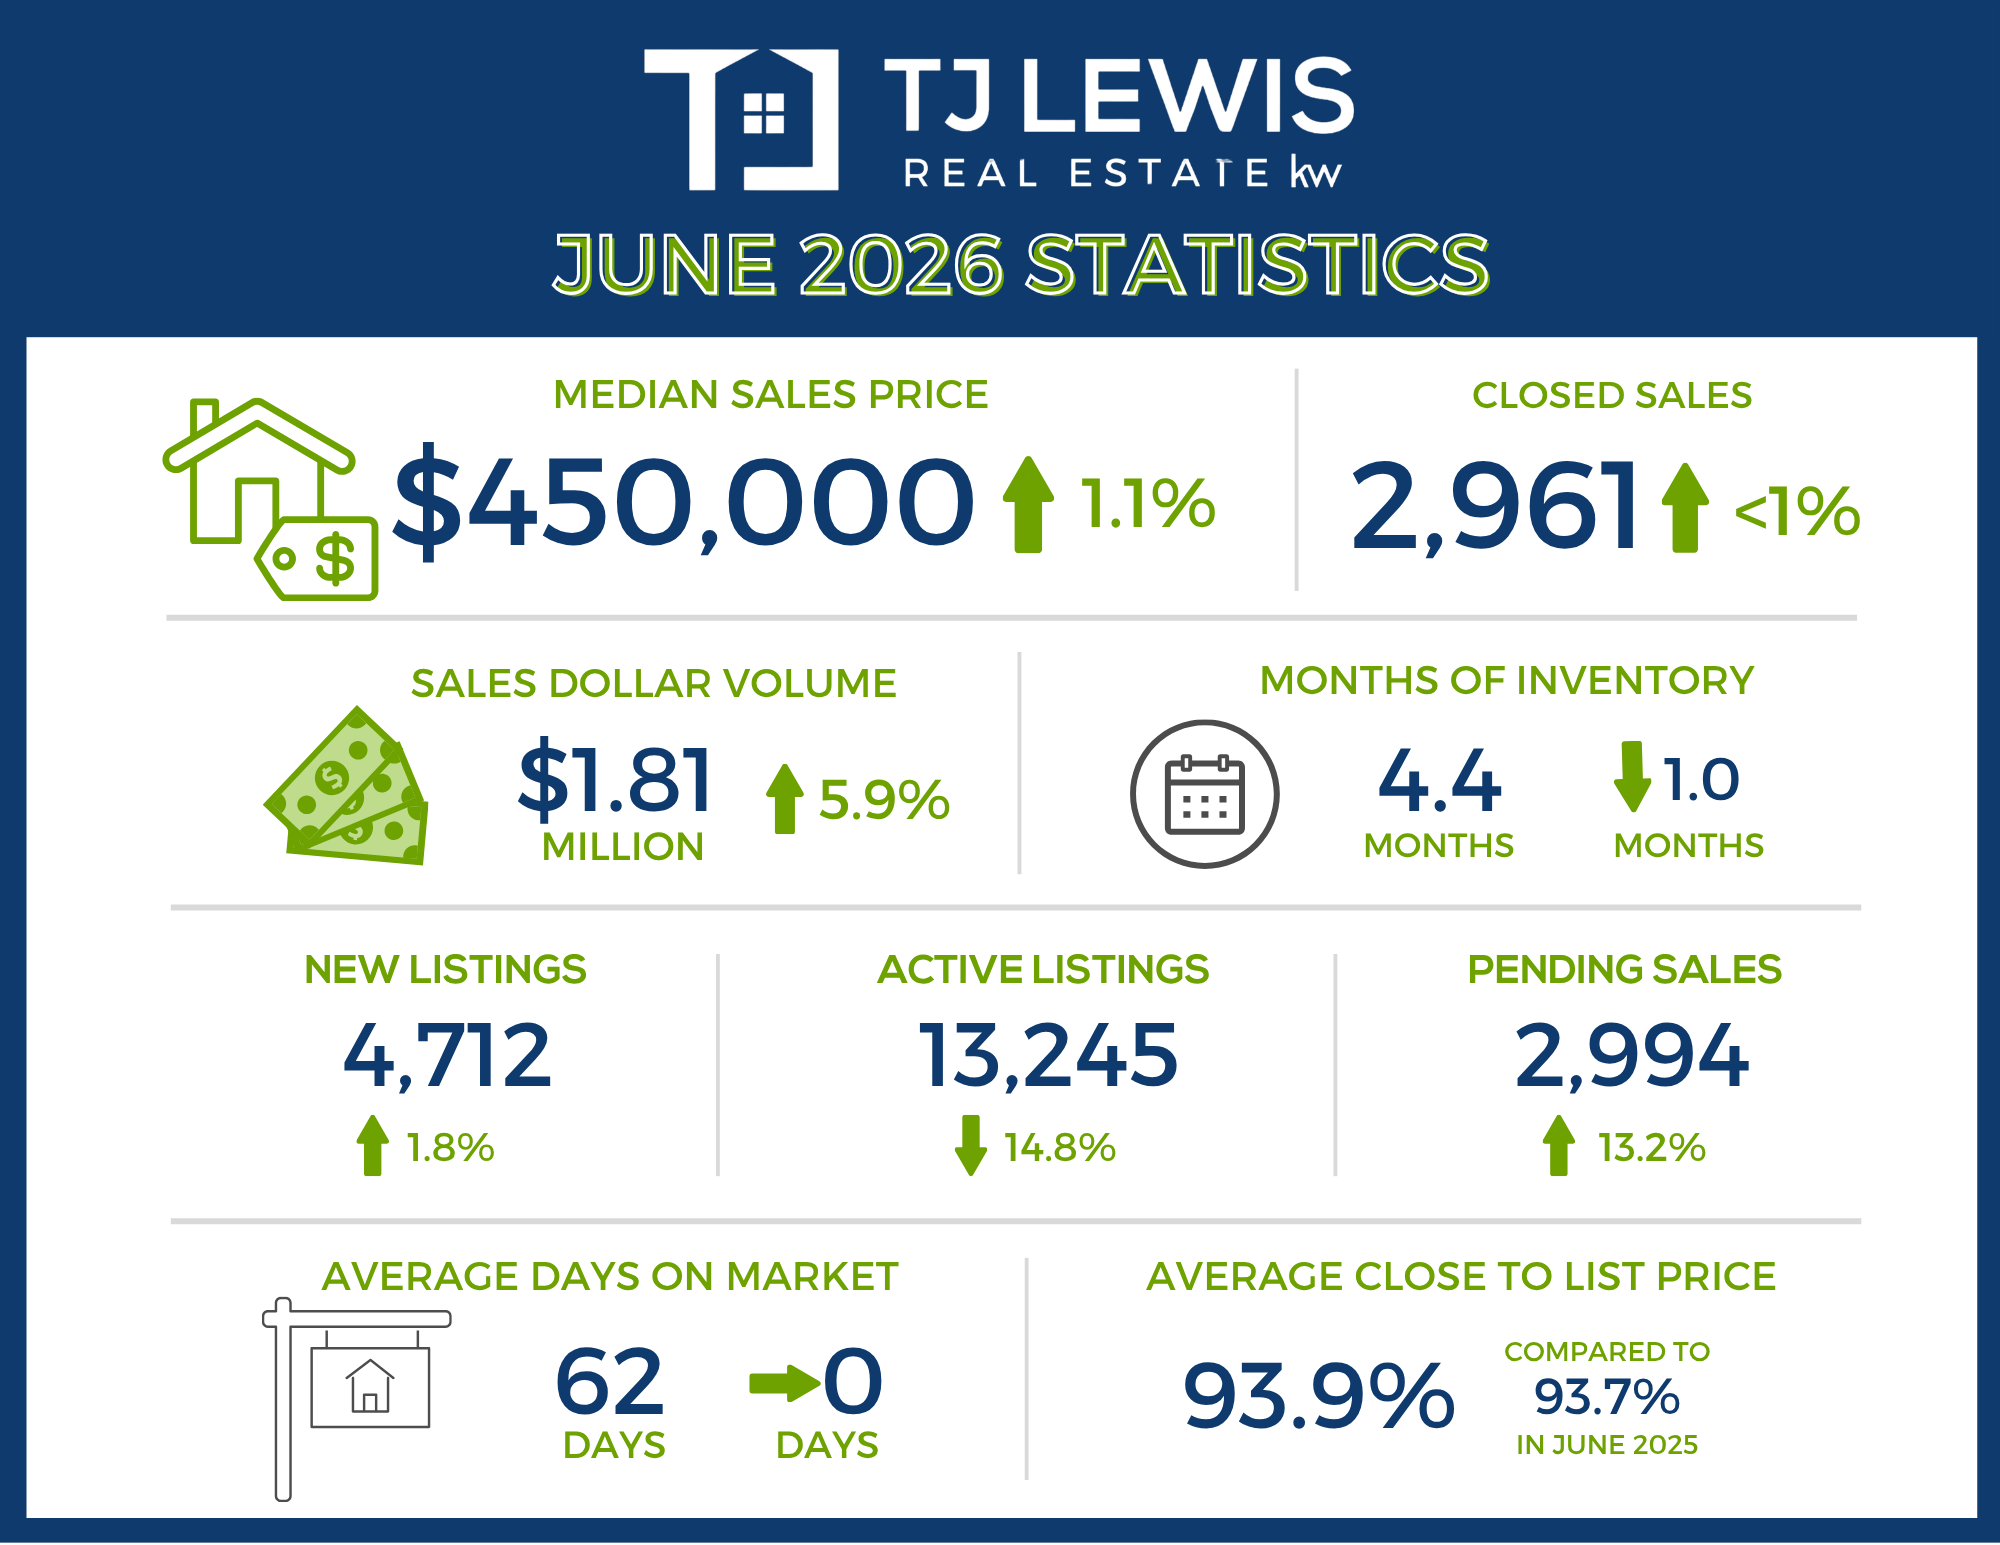
2,961 – Residential homes sold, 0.6% more than June 2025.
-
$450,000 – Median price for residential homes, 1.1% more than June 2025.
-
4,712 – New home listings on the market, 1.8% more than June 2025.
-
13,245 – Active home listings on the market, 14.8% less than June 2025.
-
2,994 – Pending sales, 13.2% more than June 2025.
-
4.4 – Months of inventory, 1.0 months less June 2025.
-
$1,814,149,897 – Total dollar volume of homes sold, 5.9% more than June 2025.
-
93.9% – Average close to list price, compared to 93.7% in June 2025.
Year to Date Sales
-
15,698 – Residential homes sold, 4.8% more than the first half of 2025.
-
$425,000 – Median price for residential homes, 2.4% less than the first half of 2025.
-
28,042 – New home listings on the market, 3.3% less than the first half of 2025.
-
77,888 – Active home listings on the market, 1.8% more than the first half of 2025.
-
17,461 – Pending sales, 9.8% more than the first half of 2025.
-
$8,964,335,285 – Total dollar volume of homes sold, 4.2% more than the first half of 2025.
Year to Date Leases
-
17,185 – Closed leases, 7.3% more than the first half of 2025.
-
$2,100 – Median price for rent, 4.3% less than the first half of 2025.
-
21,134 – New lease listings on the market, 0.4% more than the first half of 2025.
-
25,703 – Active lease listings on the market, 4.7% less than the first half of 2025.
-
18,150 – Pending leases, 8.0% more than the first half of 2025.
-
$40,113,693 – Total dollar volume of leases, 3.2% more than the first half of 2025.
City of Austin
June 2026 Sales
-
1,054 – Residential homes sold, 4.6% more than June 2025.
-
$605,000 – Median price for residential homes, 3.6% more than June 2025.
-
1,665 – New home listings on the market, 3.3% less than June 2025.
-
4,665 – Active home listings on the market, 22.1% less than June 2025.
-
1,024 – Pending sales, 16.5% more than June 2025.
-
4.3 – Months of inventory, 1.7 months less than June 2025.
-
$859,091,915 – Total dollar volume of homes sold, 8.1% more than June 2025.
-
94.5% – Average close to list price, compared to 93.6% in June 2025.
Year to Date Sales
-
5,396 – Residential homes sold, 6.4% more than the first half of 2025.
-
$572,500 – Median price for residential homes, 1.3% less than the first half of 2025.
-
10,298 – New home listings on the market, 7.4% less than the first half of 2025.
-
26,772 – Active home listings on the market, 5.8% less than the first half of 2025.
-
6,009 – Pending sales, 11.4% more than the first half of 2025.
-
$4,133,814,934 – Total dollar volume of homes sold, 5.5% more than the first half of 2025.
Year to Date Leases
-
8,993 – Closed leases, 11.0% more than the first half of 2025.
-
$2,175 – Median price for rent, 5.4% less than the first half of 2025.
-
11,128 – New lease listings on the market, 3.6% more than the first half of 2025.
-
13,127 – Active lease listings on the market, 2.4% less than the first half of 2025.
-
9,446 – Pending leases, 10.0% more than the first half of 2025.
-
$22,432,936 – Total dollar volume of leases, 5.0% more than the first half of 2025.
Travis County
June 2026 Sales
-
1,389 – Residential homes sold, 6.7% more than June 2025.
-
$542,000 – Median price for residential homes, 4.0% more than June 2025.
-
2,229 – New home listings on the market, 0.6% more than June 2025.
-
6,439 – Active home listings on the market, 17.7% less than June 2025.
-
1,356 – Pending sales, 16.7% more than June 2025.
-
4.7 – Months of inventory, 1.4 less than June 2025.
-
$1,056,287,319 – Total dollar volume of homes sold, 13.1% more than June 2025.
-
94.2% – Average close to list price, compared to 93.6% in June 2025.
Year to Date Sales
-
7,092 – Residential homes sold, 6.5% more than the first half of 2025.
-
$499,900 – Median price for residential homes, 2.0% less than the first half of 2025.
-
13,721 – New home listings on the market, 4.1% less than the first half of 2025.
-
37,488 – Active home listings on the market, 0.8% less than the first half of 2025.
-
7,919 – Pending sales, 12.7% more than the first half of 2025.
-
$4,991,259,152 – Total dollar volume of homes sold, 6.2% more than the first half of 2025.
Year to Date Leases
-
10,039 – Closed leases, 9.4% more than the first half of 2025.
-
$2,150 – Median price for rent, 4.4% less than the first half of 2025.
-
12,628 – New lease listings on the market, 4.6% more than the first half of 2025.
-
15,766 – Active lease listings on the market, 0.5% less than the first half of 2025.
-
10,544 – Pending leases, 8.9% more than the first half of 2025.
-
$24,906,991 – Total dollar volume of leases, 3.9% more than the first half of 2025.
Williamson County
June 2026 Sales
-
1,001 – Residential homes sold, 4.3% more than June 2025.
-
$426,800 – Median price for residential homes, 0.5% more than June 2025.
-
1,514 – New home listings on the market, 5.9% more than June 2025.
-
3,999 – Active home listings on the market, 14.0% less than June 2025.
-
1,037 – Pending sales, 14.5% more than June 2025.
-
3.7 – Months of inventory, 1.2 less than June 2025.
-
$493,204,611 – Total dollar volume of homes sold, 5.3% more than June 2025.
-
93.8% – Average close to list price, compared to 94.1% in June 2025.
Year to Date Sales
-
5,410 – Residential homes sold, 7.0% more than the first half of 2025.
-
$408,000 – Median price for residential homes, 2.9% less than the first half of 2025.
-
8,797 – New home listings on the market, 0.9% less than the first half of 2025.
-
23,666 – Active home listings on the market, 4.2% more than the first half of 2025.
-
5,998 – Pending sales, 12.2% more than the first half of 2025.
-
$2,547,917,665 – Total dollar volume of homes sold, 5.0% more than the first half of 2025.
Year to Date Leases
-
5,271 – Closed leases, 4.4% more than the first half of 2025.
-
$2,099 – Median price for rent, 2.3% less than the first half of 2025.
-
6,110 – New lease listings on the market, 7.4% less than the first half of 2025.
-
6,796 – Active lease listings on the market, 15.2% less than the first half of 2025.
-
5,600 – Pending leases, 6.4% more than the first half of 2025.
-
$11,355,587 – Total dollar volume of leases, 2.0% more than the first half of 2025.
Hays County
June 2026 Sales
-
390 – Residential homes sold, 22.8% less than June 2025.
-
$400,000 – Median price for residential homes, 9.0% more than June 2025.
-
634 – New home listings on the market, 9.3% less than June 2025.
-
1,819 – Active home listings on the market, 13.0% less than June 2025.
-
409 – Pending sales, 0.7% more than June 2025.
-
4.8 – Months of inventory, 0.5 months more than June 2025.
-
$195,640,921 – Total dollar volume of homes sold, 19.2% less than June 2025.
-
93.6% – Average close to list price, compared to 93.2% in June 2025.
Year to Date Sales
-
2,226 – Residential homes sold, 5.2% less than the first half of 2025.
-
$370,573 – Median price for residential homes, 0.7% less than the first half of 2025.
-
3,708 – New home listings on the market, 9.1% less than the first half of 2025.
-
10,789 – Active home listings on the market, 1.1% less than the first half of 2025.
-
2,456 – Pending sales, 3.5% less than the first half of 2025.
-
$1,075,305,200 – Total dollar volume of homes sold, 4.9% less than the first half of 2025.
Year to Date Leases
-
1,414 – Closed leases, 2.2% more than the first half of 2025.
-
$1,995 – Median price for rent, flat compared to the first half of 2025.
-
1,769 – New lease listings on the market, 1.2% less than the first half of 2025.
-
2,251 – Active lease listings on the market, 7.1% less than the first half of 2025.
-
1,522 – Pending leases, 6.3% more than the first half of 2025.
-
$3,003,911 – Total dollar volume of leases, 0.5% more than the first half of 2025.
Bastrop County
June 2026 Sales
-
137 – Residential homes sold, 0.7% more than June 2025.
-
$344,900 – Median price for residential homes, 6.8% less than June 2025.
-
234 – New home listings on the market, 3.1% more than June 2025.
-
749 – Active home listings on the market, 5.4% less than June 2025.
-
140 – Pending sales, 14.8% more than June 2025.
-
6.6 – Months of inventory, 0.2 months more than June 2025.
-
$54,578,691 – Total dollar volume of homes sold, 3.5% less than June 2025.
-
93.5% – Average close to list price, compared to 94.6% in June 2025.
Year to Date Sales
-
703 – Residential homes sold, 3.2% more than the first half of 2025.
-
$339,990 – Median price for residential homes, 2.9% less than the first half of 2025.
-
1,324 – New home listings on the market, 2.1% less than the first half of 2025.
-
4,571 – Active home listings on the market, 11.7% more than the first half of 2025.
-
794 – Pending sales, 6.9% more than the first half of 2025.
-
$270,336,996 – Total dollar volume of homes sold, 0.7% less than the first half of 2025.
Year to Date Leases
-
313 – Closed leases, 11.8% more than the first half of 2025.
-
$1,900 – Median price for rent, 2.6% less than the first half of 2025.
-
453 – New lease listings on the market, 8.4% more than the first half of 2025.
-
617 – Active lease listings on the market, 27.7% more than the first half of 2025.
-
336 – Pending leases, 14.3% more than the first half of 2025.
-
$603,754 – Total dollar volume of leases, 7.4% more than the first half of 2025.
Caldwell County
June 2026 Sales
-
44 – Residential homes sold, 12.8% more than June 2025.
-
$260,495 – Median price for residential homes, 10.2% less than June 2025.
-
101 – New home listings on the market, 74.1% more than June 2025.
-
239 – Active home listings on the market, 36.6% more than June 2025.
-
52 – Pending sales, 4.0% more than June 2025.
-
5.6 – Months of inventory, 0.9 months more than June 2025.
-
$14,438,355 – Total dollar volume of homes sold, 15.8% more than June 2025.
-
93.1% – Average close to list price, compared to 91.1% in June 2025.
Year to Date Sales
-
267 – Residential homes sold, 17.1% more than the first half of 2025.
-
$242,000 – Median price for residential homes, 19.3% less than the first half of 2025.
-
492 – New home listings on the market, 26.2% more than the first half of 2025.
-
1,374 – Active home listings on the market, 36.0% more than the first half of 2025.
-
294 – Pending sales, 21.5% more than the first half of 2025.
-
$79,516,272 – Total dollar volume of homes sold, 7.5% more than the first half of 2025.
Year to Date Leases
-
148 – Closed leases, 20.3% more than the first half of 2025.
-
$1,700 – Median price for rent, 5.0% less than the first half of 2025.
-
174 – New lease listings on the market, 5.5% more than the first half of 2025.
-
273 – Active lease listings on the market, 46.8% more than the first half of 2025.
-
148 – Pending leases, 14.7% more than the first half of 2025.
-
$243,450 – Total dollar volume of leases, 19.5% more than the first half of 2025.
Recent Posts