July 2025 Central Texas Housing Market Report

Central Texas Housing Market Moves in Step with Summer Trends
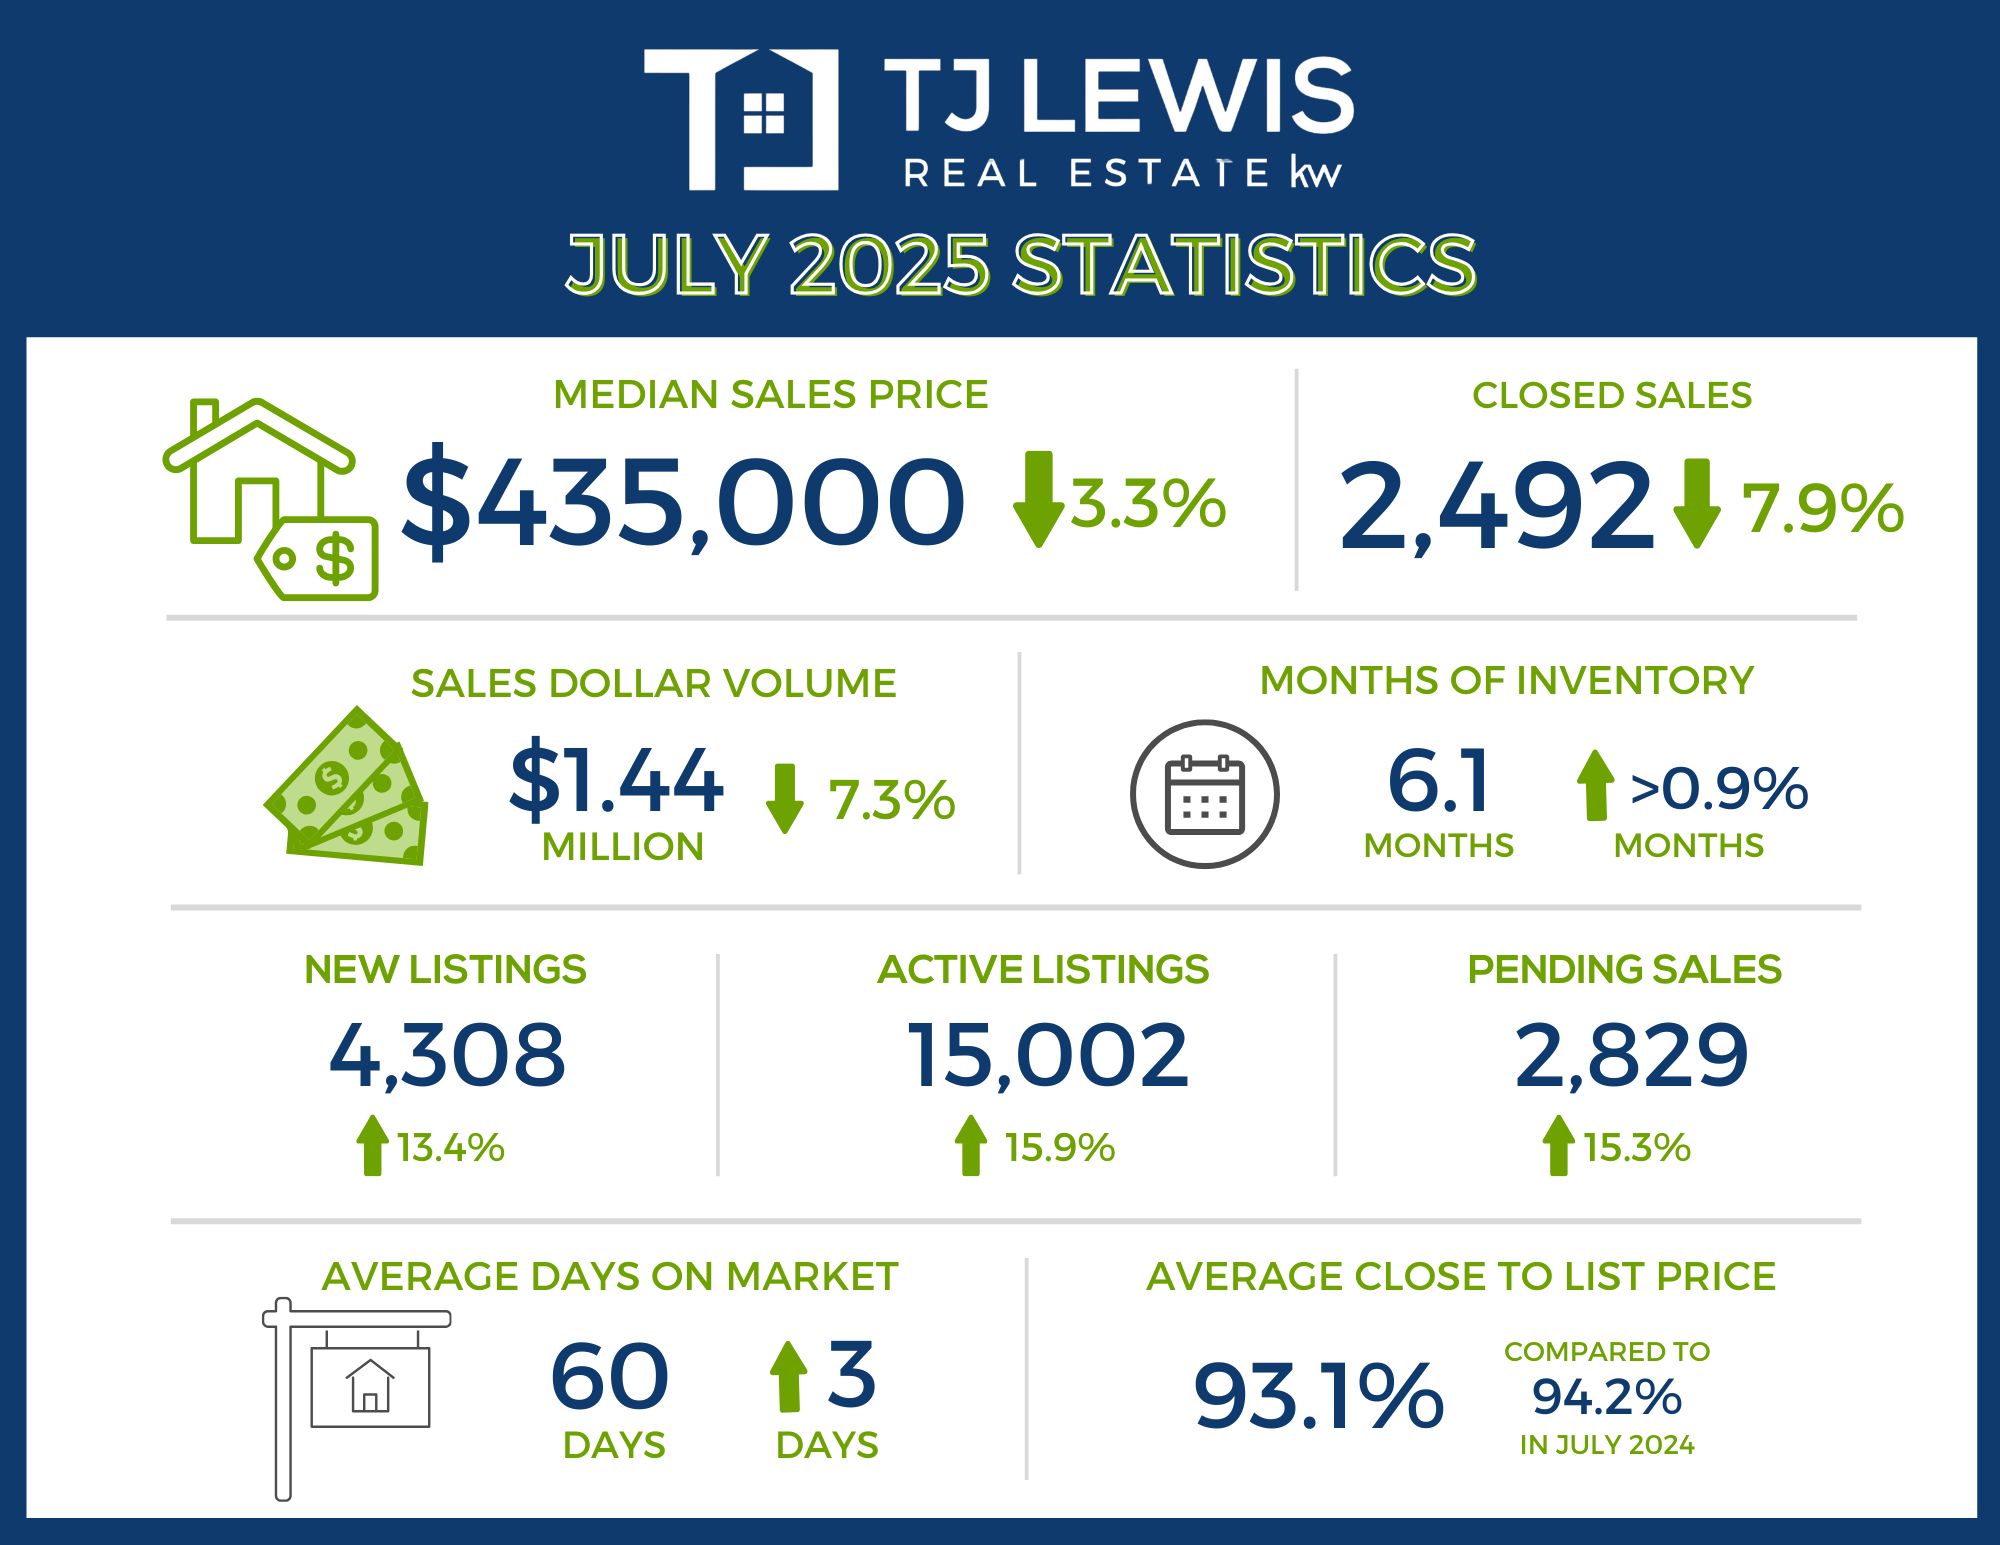
The July 2025 Central Texas Housing Report from Unlock MLS shows the market moving right in line with seasonal patterns. The Austin-Round Rock-San Marcos area recorded 2,492 sales—down 7.9% from last July—with a median price of $435,000. Sales slowed and prices adjusted slightly, while inventory remained higher than in 2024 despite a small dip from June. Pending sales jumped more than 15%, hinting at stronger activity as we move into fall.
Vaike O’Grady, research advisor at Unlock MLS, said the numbers reflect what’s typical for this time of year, supported by steady economic growth in Central Texas.“It’s typical for the summer market to slow as people focus on travel and leisure; we often see activity pick back up once school starts. The year-over-year growth in pending closings is encouraging. Inventory is higher than in recent years, giving buyers more options, but the month-to-month dip in new and active listings suggests some sellers may be holding back. If interest rates shift lower this fall, we could see seller and buyer activity accelerate.”
Brandy Wuensch, 2025 Unlock MLS and ABoR president, emphasized the value of working with a REALTOR® in today’s market.
“Austin is consistently ranked among the top places to live in the U.S. This creates opportunities for buyers and renters. If you’re looking to buy or lease, this slower pace can work to your advantage. If you’re selling, well-priced homes are still moving quickly. Navigating our market can be complex, so working with a knowledgeable REALTOR® is the best way to position yourself for success.”
With interest rates holding steady for now, more inventory on the market, and pending sales on the rise, Central Texas is set up for a busy fall season. Whether buying, selling, or leasing, having the right guidance can help you make the most of the opportunities ahead.
Austin-Round Rock-San Marcos MSA
-
July 2025 - For Sale
-
2,492 – Residential homes sold, 7.9% less than July 2024.
-
$435,000 – Median price for residential homes, 3.3% less than July 2024.
-
4,308 – New home listings on the market, 13.4% more than July 2024.
-
15,002 – Active home listings on the market, 15.9% more than July 2024.
-
2,829 – Pending sales, 15.3% more than July 2024.
-
6.1 – Months of inventory, 0.9 months more than July 2024.
-
$1,440,357,791 – Total dollar volume of homes sold, 7.3% less than July 2024.
-
93.1% – Average close to list price, compared to 94.2% in July 2024.
-
July 2025 - For Lease
-
2,701 – Closed leases, 6.4% less than July 2024.
-
$2,295 – Median price for rent, 0.2% less than July 2024.
-
3,671 – New lease listings on the market, 0.5% less than July 2024.
-
5,741 – Active lease listings on the market, 0.9% less than July 2024.
-
2,873 – Pending leases, 2.5% more than July 2024.
-
2.0 – Months of inventory, flat compared to July 2024
-
$7,055,985 – Total dollar volume of leases, 5.4% less than July 2024.
-
99.7% – Average close to list price, compared to 99.9% in July 2024.
City of Austin
-
July 2025 - For Sale
-
884 – Residential homes sold, 1.7% less than July 2024.
-
$590,000 – Median price for residential homes, 2.2% more than July 2024.
-
1,550 – New home listings on the market, 14.1% more than July 2024.
-
5,673 – Active home listings on the market, 14.5% more than July 2024.
-
981 – Pending sales, 22.2% more than July 2024.
-
6.9 – Months of inventory, 1.0 months more than July 2024.
-
$672,958,414 – Total dollar volume of homes sold, flat compared to July 2024.
-
93.8% – Average close to list price, compared to 92.9% in July 2024.
-
July 2025 - For Lease
-
1,359 – Closed leases, 8.9% less than July 2024.
-
$2,795 – Median price for rent, 1.6% more than July 2024.
-
1,754 – New lease listings on the market, 3.4% less than July 2024.
-
2,725 – Active lease listings on the market, 10.7% less than July 2024.
-
1,441 – Pending leases, 1.5% more than July 2024.
-
2.0 – Months of inventory, flat compared to July 2024.
-
$3,932,036 – Total dollar volume of leases, 6.7% less than July 2024.
-
99.8% – Average close to list price, compared to 99.5% in July 2024.
Travis County
-
July 2025 - For Sale
-
1,121 – Residential homes sold, 4.7% less than July 2024.
-
$525,000 – Median price for residential homes, 1.0% more than July 2024.
-
1,993 – New home listings on the market, 12.5% more than July 2024.
-
7,437 – Active home listings on the market, 14.5% more than July 2024.
-
1,260 – Pending sales, 15.6% more than July 2024.
-
6.9 – Months of inventory, 0.8 months more than July 2024.
-
$800,560,074 – Total dollar volume of homes sold, 2.3% less than July 2024.
-
93.0% – Average close to list price, compared to 93.9% in July 2024.
-
July 2025 - For Lease
-
1,536 – Closed leases, 9.4% less than July 2024.
-
$2,400 – Median price for rent, 2.4% less than July 2024.
-
2,025 – New lease listings on the market, 1.8% less than July 2024.
-
3,096 – Active lease listings on the market, 5.4% less than July 2024.
-
1,630 – Pending leases, 2.3% more than July 2024.
-
2.0 – Months of inventory, flat compared to July 2024.
-
$4,348,974 – Total dollar volume of leases, 8.2% less than July 2024.
-
96.0% – Average close to list price, compared to 96.5% in July 2024.
Williamson County
-
July 2025 - For Sale
-
850 – Residential homes sold, 11.1% less than July 2024.
-
$419,995 – Median price for residential homes, 1.6% less than July 2024.
-
1,488 – New home listings on the market, 18.3% more than July 2024.
-
4,651 – Active home listings on the market, 25.3% more than July 2024.
-
936 – Pending sales, 12.2% more than July 2024.
-
5.5 – Months of inventory, 1.3 months more than July 2024.
-
$406,626,407 – Total dollar volume of homes sold, 12.8% less than July 2024.
-
93.3% – Average close to list price, compared to 94.6% in July 2024.
-
July 2025 - For Lease
-
850 – Closed leases, 11.1% less than July 2024.
-
$2,200 – Median price for rent, 1.1% less than July 2024.
-
1,236 – New lease listings on the market, 1.6% less than July 2024.
-
1,894 – Active lease listings on the market, 8.0% more than July 2024.
-
946 – Pending leases, 5.7% more than July 2024.
-
2.0 – Months of inventory, flat compared to July 2024.
-
$2,041,034 – Total dollar volume of leases, 0.8% less than July 2024.
-
97.0% – Average close to list price, flat compared to July 2024.
Hays County
-
July 2025 - For Sale
-
363 – Residential homes sold, 11.9% less than July 2024.
-
$365,000 – Median price for residential homes, 4.6% less than July 2024.
-
585 – New home listings on the market, 7.5% more than July 2024.
-
1,974 – Active home listings on the market, 2.9% more than July 2024.
-
469 – Pending sales, 26.4% more than July 2024.
-
5.2 – Months of inventory, 0.2 months more than July 2024.
-
$177,111,723 – Total dollar volume of homes sold, 13.3% less than July 2024.
-
92.6% – Average close to list price, compared to 94.3% in July 2024.
-
July 2025 - For Lease
-
229 – Closed leases, 7.7% less than July 2024.
-
$2,350 – Median price for rent, 2.2% more than July 2024.
-
317 – New lease listings on the market, 5.3% more than July 2024.
-
505 – Active lease listings on the market, 15.3% more than July 2024.
-
231 – Pending leases, 10.1% less than July 2024.
-
2.0 – Months of inventory, flat compared to July 2024.
-
$545,942 – Total dollar volume of leases, 2.8% less than July 2024.
-
97.5% – Average close to list price, compared to 96.7% in July 2024.
Bastrop County
-
July 2025 - For Sale
-
116 – Residential homes sold, 3.3% less than July 2024.
-
$336,749 – Median price for residential homes, 2.7% less than July 2024.
-
187 – New home listings on the market, 10.0% more than July 2024.
-
786 – Active home listings on the market, 19.6% more than July 2024.
-
115 – Pending sales, 0.9% less than July 2024.
-
7.5 – Months of inventory, 0.1 months more than July 2024.
-
$42,344,395 – Total dollar volume of homes sold, 14.0% less than July 2024.
-
93.9% – Average close to list price, compared to 94.4% in July 2024.
-
July 2025 - For Lease
-
44 – Closed leases, 18.9% more than July 2024.
-
$2,000 – Median price for rent, 1.2% less than July 2024.
-
61 – New lease listings on the market, 14.1% less than July 2024.
-
116 – Active lease listings on the market, 13.7% more than July 2024.
-
49 – Pending leases, 19.5% more than July 2024.
-
3.0 – Months of inventory, flat compared to July 2024.
-
$94,615 – Total dollar volume of leases, 29.8% more than July 2024.
-
96.8% – Average close to list price, compared to 97.4% in July 2024.
Caldwell County
-
July 2025 - For Sale
-
39 – Residential homes sold, 4.9% less than July 2024.
-
$300,000 – Median price for residential homes, 0.8% less than July 2024.
-
58 – New home listings on the market, 3.6% more than July 2024.
-
166 – Active home listings on the market, 3.8% more than July 2024.
-
49 – Pending sales, 14.0% more than July 2024.
-
4.5 – Months of inventory, 0.5 months more than July 2024.
-
$13,136,492 – Total dollar volume of homes sold, 6.9% less than July 2024.
-
92.3% – Average close to list price, compared to 95.6% in July 2024.
-
July 2025 - For Lease
-
14 – Closed leases, 17.6% less than July 2024.
-
$1,823 – Median price for rent, 1.3% less than July 2024.
-
23 – New lease listings on the market, 130.0% more than July 2024.
-
39 – Active lease listings on the market, 95.0% more than July 2024.
-
18 – Pending leases, 20.0% more than July 2024.
-
3.0 – Months of inventory, 2.0 months more than July 2024.
-
$25,420 – Total dollar volume of leases, 17.1% less than July 2024.
-
98.6% – Average close to list price, compared to 96.0% in July 2024.
Recent Posts