September 2025 Central Texas Housing Market Report
Central Texas housing market posts largest gain in closed sales in 2025
Renewed buyer confidence and steady prices mark a healthy, seasonal market
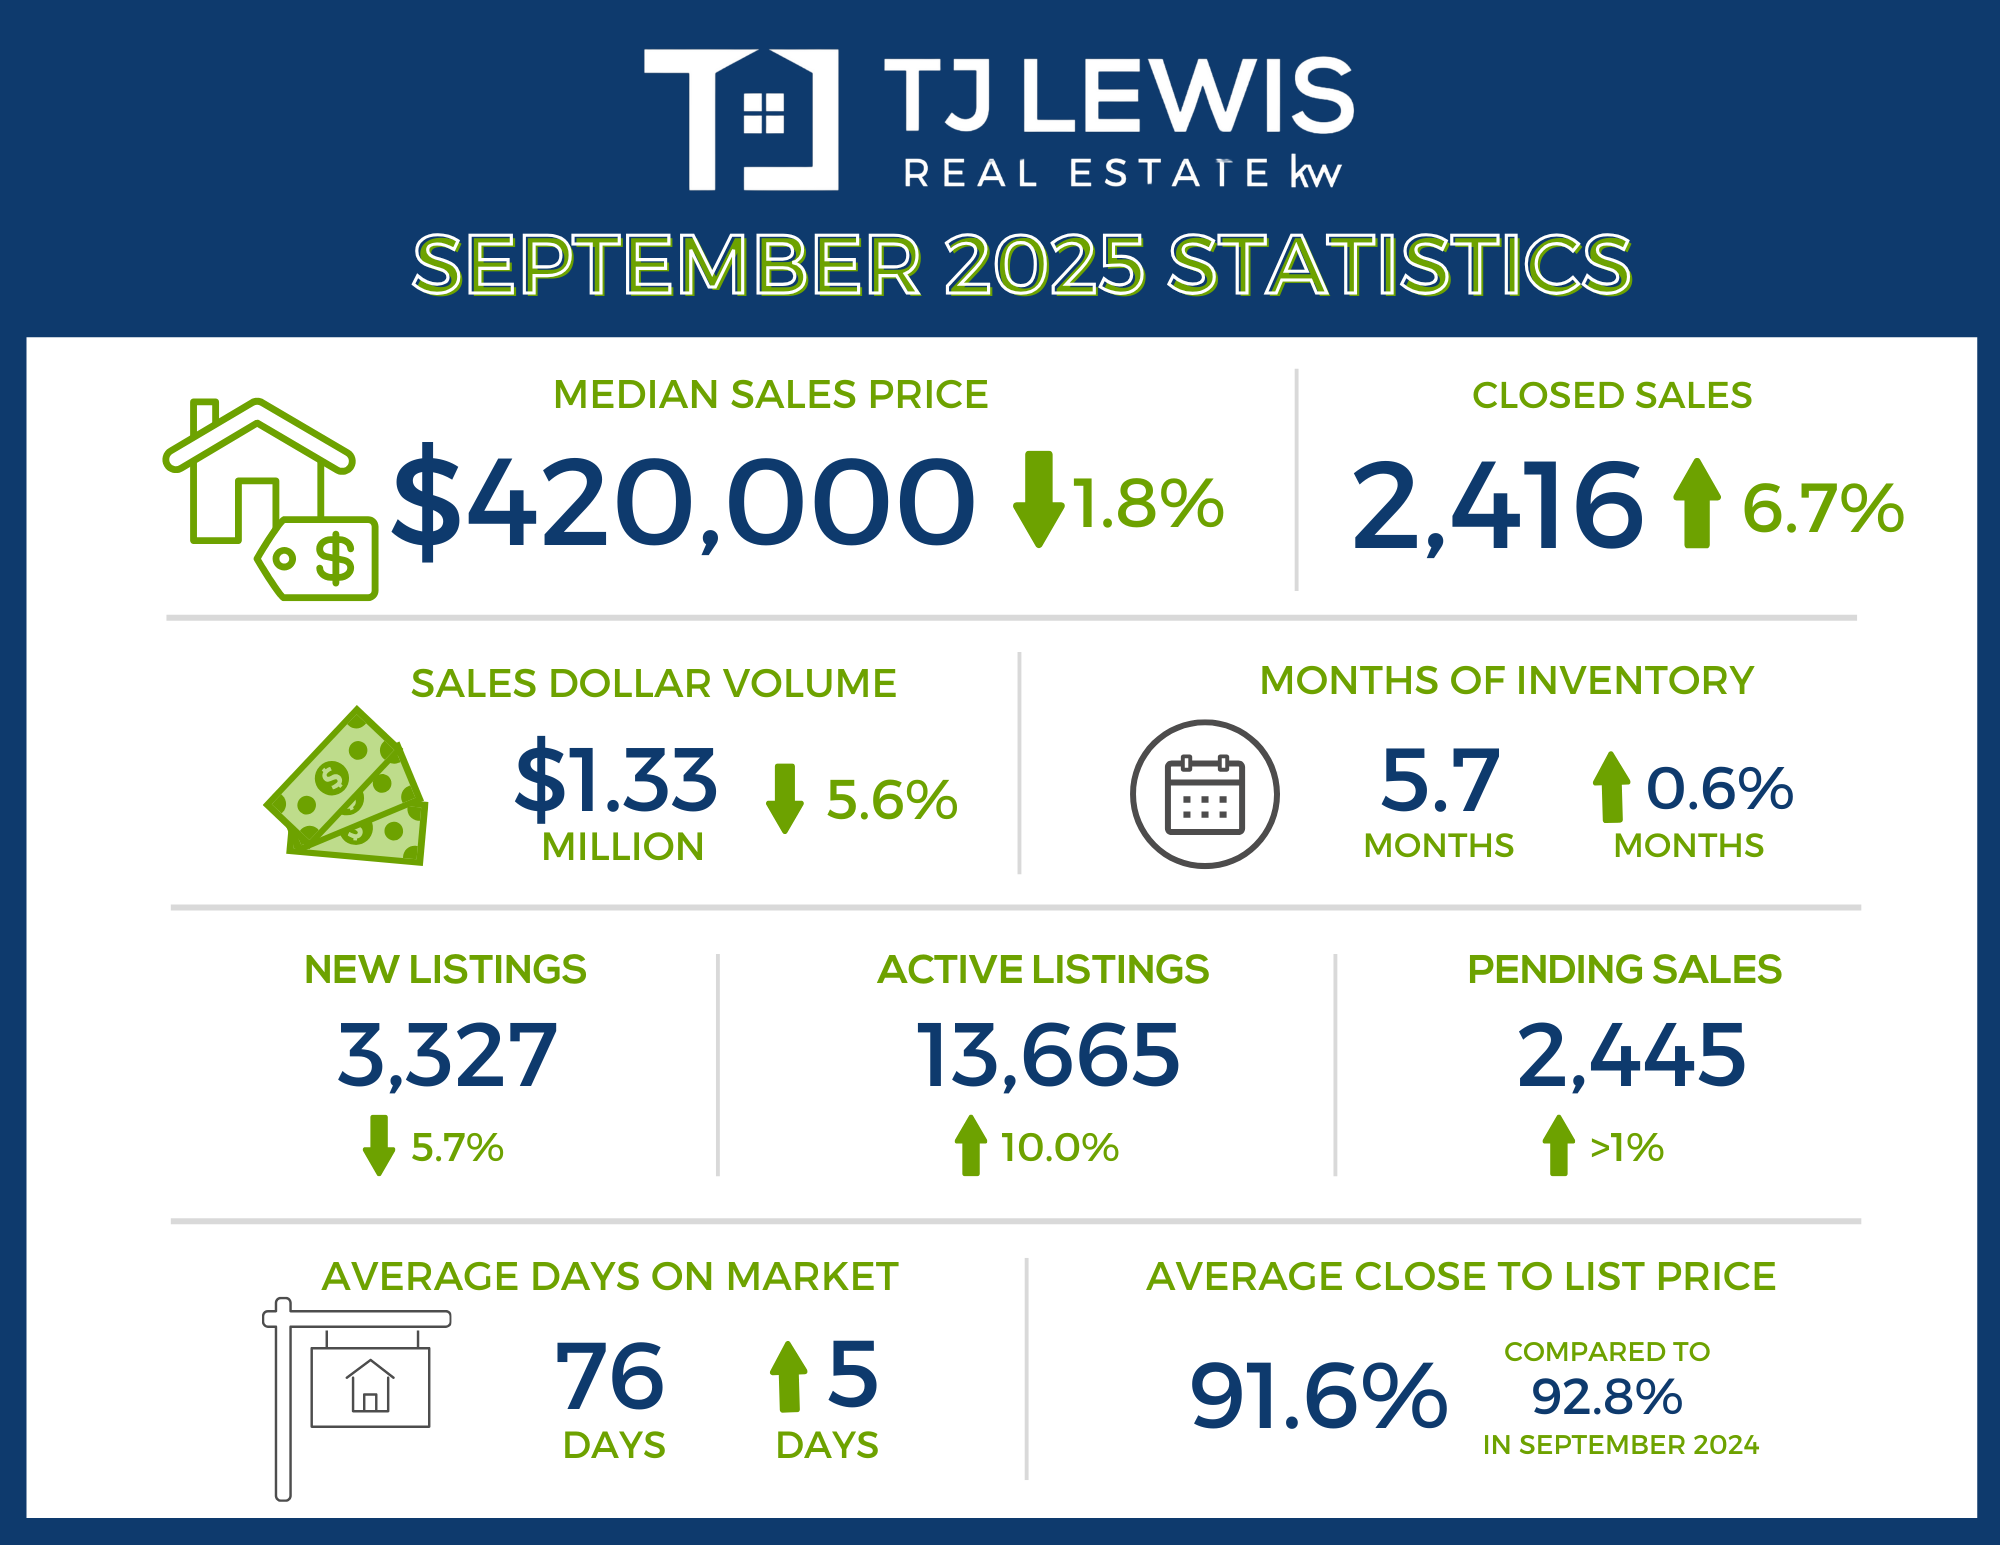
The Central Texas housing market finished the third quarter on a high note, posting its strongest sales growth of the year. According to the latest Central Texas Housing Report from Unlock MLS, closed sales rose 6.7% year over year to 2,416, marking the largest gain of 2025. Meanwhile, the median sales price dipped slightly by 1.8% to $420,000, reflecting a market that’s staying active and balanced as it moves through the fall season.
This mix of steady pricing and growing buyer activity points to renewed confidence among homebuyers—especially following the first interest rate cut in nine months.
Vaike O’Grady, research advisor at Unlock MLS, said the numbers line up with what’s expected for this time of year:
“The numbers we’re seeing in September match the trends we expected to see this time of year. As we wrap up the third quarter, the market is mirroring typical seasonality trends, pointing to a sign of continued adjustment and balance. Buyer enthusiasm has picked up slightly as we saw the first interest rate cut in nine months, and steady pricing from sellers continues to support that confidence. What we’re seeing in the market now is a healthy level of stability. Homes may be taking a bit longer to sell, but they’re still selling, and buyers are meeting sellers where they are. This consistency shows that the market is functioning as it should—steady, sustainable and well-positioned heading into the end of the year.”
Brandy Wuensch, 2025 Unlock MLS and ABoR president, noted that this stability reinforces the value of working with a trusted real estate professional:
“Homeownership involves a range of costs—from property taxes and insurance to ongoing maintenance—and REALTORS® help buyers understand that complete picture. Our role is to guide people toward decisions that support their long-term homeownership goals by giving them the knowledge and resources they need to navigate the process with confidence.”
As 2025 enters its final quarter, Central Texas continues to show resilience. With steady prices, improving buyer confidence, and a market moving at a healthy, sustainable pace, both buyers and sellers are finding new opportunities to make smart moves before the year wraps up.
September 2025 - For Sale
-
2,416 – Residential homes sold, 6.7% more than September 2024.
-
$420,000 – Median price for residential homes, 1.8% less than September 2024.
-
3,327 – New home listings on the market, 5.7% less than September 2024.
-
13,665 – Active home listings on the market, 10.0% more than September 2024.
-
2,445 – Pending sales, 0.3% more than September 2024.
-
5.7 – Months of inventory, 0.6 months more than September 2024.
-
$1,334,701,789 – Total dollar volume of homes sold, 5.6% more than September 2024.
-
91.6% – Average close to list price, compared to 92.8% in September 2024.
September 2025 - For Lease
-
1,951 – Closed leases, 6.9% less than September 2024.
-
$2,200– Median price for rent, flat compared to September 2024.
-
2,723 – New lease listings on the market, 9.3% more than September 2024.
-
5,919 – Active lease listings on the market, 2.8% more than September 2024.
-
2,125 – Pending leases, 4.5% more than September 2024.
-
3.0 – Months of inventory, 0.4 months more than September 2024.
-
$4,949,723 – Total dollar volume of leases, 3.4% less than September 2024.
-
95.0% – Average close to list price, compared to 94.2% in September 2024.
City of Austin
September 2025 - For Sale
-
837 – Residential homes sold, 16.6% more than September 2024.
-
$550,000 – Median price for residential homes, 6.0% less than September 2024.
-
1,271 – New home listings on the market, 0.8% more than September 2024.
-
4,915 – Active home listings on the market, 6.7% more than September 2024.
-
835 – Pending sales, 7.7% more than September 2024.
-
5.9 – Months of inventory, 0.3 months more than September 2024.
-
$610,185,636 – Total dollar volume of homes sold, 14.0% more than September 2024.
-
90.9% – Average close to list price, compared to 92.0% in September 2024.
September 2025 - For Lease
-
949 – Closed leases, 12.5% less than September 2024.
-
$2,495 – Median price for rent, 6.2% more than September 2024.
-
1,383 – New lease listings on the market, 15.1% more than September 2024.
-
2,887 – Active lease listings on the market, 2.3% more than September 2024.
-
1,001 – Pending leases, 1.4% less than September 2024.
-
2.7 – Months of inventory, 0.1 months less than September 2024.
-
$2,732,151 – Total dollar volume of leases, 5.9% less than September 2024.
-
95.0% – Average close to list price, compared to 93.6% in September 2024.
Travis County
September 2025 - For Sale
-
1,065 – Residential homes sold, 9.5% more than September 2024.
-
$485,000 – Median price for residential homes, 3.6% less than September 2024.
-
1,674 – New home listings on the market, 0.8% less than September 2024.
-
6,635 – Active home listings on the market, 8.1% more than September 2024.
-
1,113 – Pending sales, 6.4% more than September 2024.
-
6.1 – Months of inventory, 0.3 months more than September 2024.
-
$714,900,142 – Total dollar volume of homes sold, 7.2% more than September 2024.
-
91.0% – Average close to list price, compared to 92.2% in September 2024.
September 2025 - For Lease
-
1,092 – Closed leases, 9.5% less than September 2024.
-
$2,400 – Median price for rent, flat compared to September 2024.
-
1,579 – New lease listings on the market, 8.6% less than September 2024.
-
3,362 – Active lease listings on the market, 1.3% more than September 2024.
-
1,143 – Pending leases, 0.3% more than September 2024.
-
2.8 – Months of inventory, flat compared to September 2024.
-
$3,054,212 – Total dollar volume of leases, 3.9% less than September 2024.
-
95.1% – Average close to list price, compared to 93.9% in September 2024.
Williamson County
September 2025 - For Sale
-
808 – Residential homes sold, 5.9% more than September 2024.
-
$406,722 – Median price for residential homes, 2.8% less than September 2024.
-
977 – New home listings on the market, 8.3% less than September 2024.
-
4,301– Active home listings on the market, 18.8% more than September 2024.
-
843 – Pending sales, 4.3% less than September 2024.
-
5.5 – Months of inventory, 1.3 months more than September 2024.
-
$379,998,760 – Total dollar volume of homes sold, 4.7% more than September 2024.
-
92.2% – Average close to list price, compared to 93.3% in September 2024.
September 2025 - For Lease
-
653 – Closed leases, 2.7% less than September 2024.
-
$2,100 – Median price for rent, flat compared to September 2024.
-
849 – New lease listings on the market, 6.7% more than September 2024.
-
1,877 – Active lease listings on the market, 4.9% more than September 2024.
-
752 – Pending leases, 9.6% more than September 2024.
-
2.3 – Months of inventory, 0.2 months more than September 2024.
-
$1,450,445 – Total dollar volume of leases, 0.9% less than September 2024.
-
94.7% – Average close to list price, compared to 94.5% in September 2024.
Hays County
September 2025 - For Sale
-
392– Residential homes sold, 3.7% more than September 2024.
-
$360,000 – Median price for residential homes, 2.6% less than September 2024.
-
429 – New home listings on the market, 15.6% less than September 2024.
-
1,763 – Active home listings on the market, 2.9% less than September 2024.
-
348 – Pending sales, 6.5% less than September 2024.
-
4.6 – Months of inventory, 0.1 months less than September 2024.
-
$181,191,743 – Total dollar volume of homes sold, 1.0% more than September 2024.
-
92.2% – Average close to list price, compared to 92.7% in September 2024.
September 2025 - For Lease
-
158 – Closed leases, 4.2% less than September 2024.
-
$2,049 – Median price for rent, 2.4% less than September 2024.
-
239 – New lease listings on the market, 1.3% more than September 2024.
-
535 – Active lease listings on the market, 3.5% more than September 2024.
-
184 – Pending leases, 17.2% more than September 2024.
-
2.7 – Months of inventory, flat compared to September 2024.
-
$351,872 – Total dollar volume of leases, 4.3% less than September 2024.
-
95.2% – Average close to list price, compared to 93.4% in September 2024.
Bastrop County
September 2025 - For Sale
-
100 – Residential homes sold, 15.3% less than September 2024.
-
$350,000 – Median price for residential homes, 1.9% less than September 2024.
-
190 – New home listings on the market, 4.4% more than September 2024.
-
791 – Active home listings on the market, 13.6% more than September 2024.
-
114 – Pending sales, 11.8% more than September 2024.
-
7.5 – Months of inventory, 1.0 months more than September 2024.
-
$48,693,026 – Total dollar volume of homes sold, 25.7% more than September 2024.
-
91.7% – Average close to list price, compared to 94.1% in September 2024.
September 2025 - For Lease
-
41 – Closed leases, 20.6% more than September 2024.
-
$1,925 – Median price for rent, 8.3% less than September 2024.
-
40 – New lease listings on the market, 7.0% less than September 2024.
-
110 – Active lease listings on the market, 2.8% more than September 2024.
-
30 – Pending leases, 23.1% less than September 2024.
-
3.0 – Months of inventory, 0.1 months less than September 2024.
-
$68,789 – Total dollar volume of leases, 26.4% less than September 2024.
-
96.1% – Average close to list price, compared to 98.8% in September 2024.
Caldwell County
September 2025 - For Sale
-
35 – Residential homes sold, 31.4% less than September 2024.
-
$303,790– Median price for residential homes, 7.2% more than September 2024.
-
57 – New home listings on the market, 1.8% more than September 2024.
-
176 – Active home listings on the market, 13.5% more than September 2024.
-
28 – Pending sales, 22.2% less than September 2024.
-
5.2 – Months of inventory, 1.5 months more than September 2024.
-
$11,588,840 – Total dollar volume of homes sold, 26.8% less than September 2024.
-
90.5% – Average close to list price, compared to 93.8% in September 2024.
September 2025 - For Lease
-
14 – Closed leases, 16.7% more than September 2024.
-
$1,800 – Median price for rent, 12.5% more than September 2024.
-
16 – New lease listings on the market, flat compared to September 2024.
-
35 – Active lease listings on the market, 34.6% more than September 2024.
-
16 – Pending leases, 45.5% more than September 2024.
-
2.4 – Months of inventory, 0.6 months more than September 2024.
-
$24,405 – Total dollar volume of leases, 21.5% more than September 2024.
-
96.5% – Average close to list price, compared to 94.6% in September 2024.
For more information or to download the September 2025 Central Texas Housing Market Report, visit UnlockMLS.com/Stats.
Recent Posts