May 2025 Central Texas Housing Market Report

Hopeful Signs for the Austin Housing Market Heading Into Summer
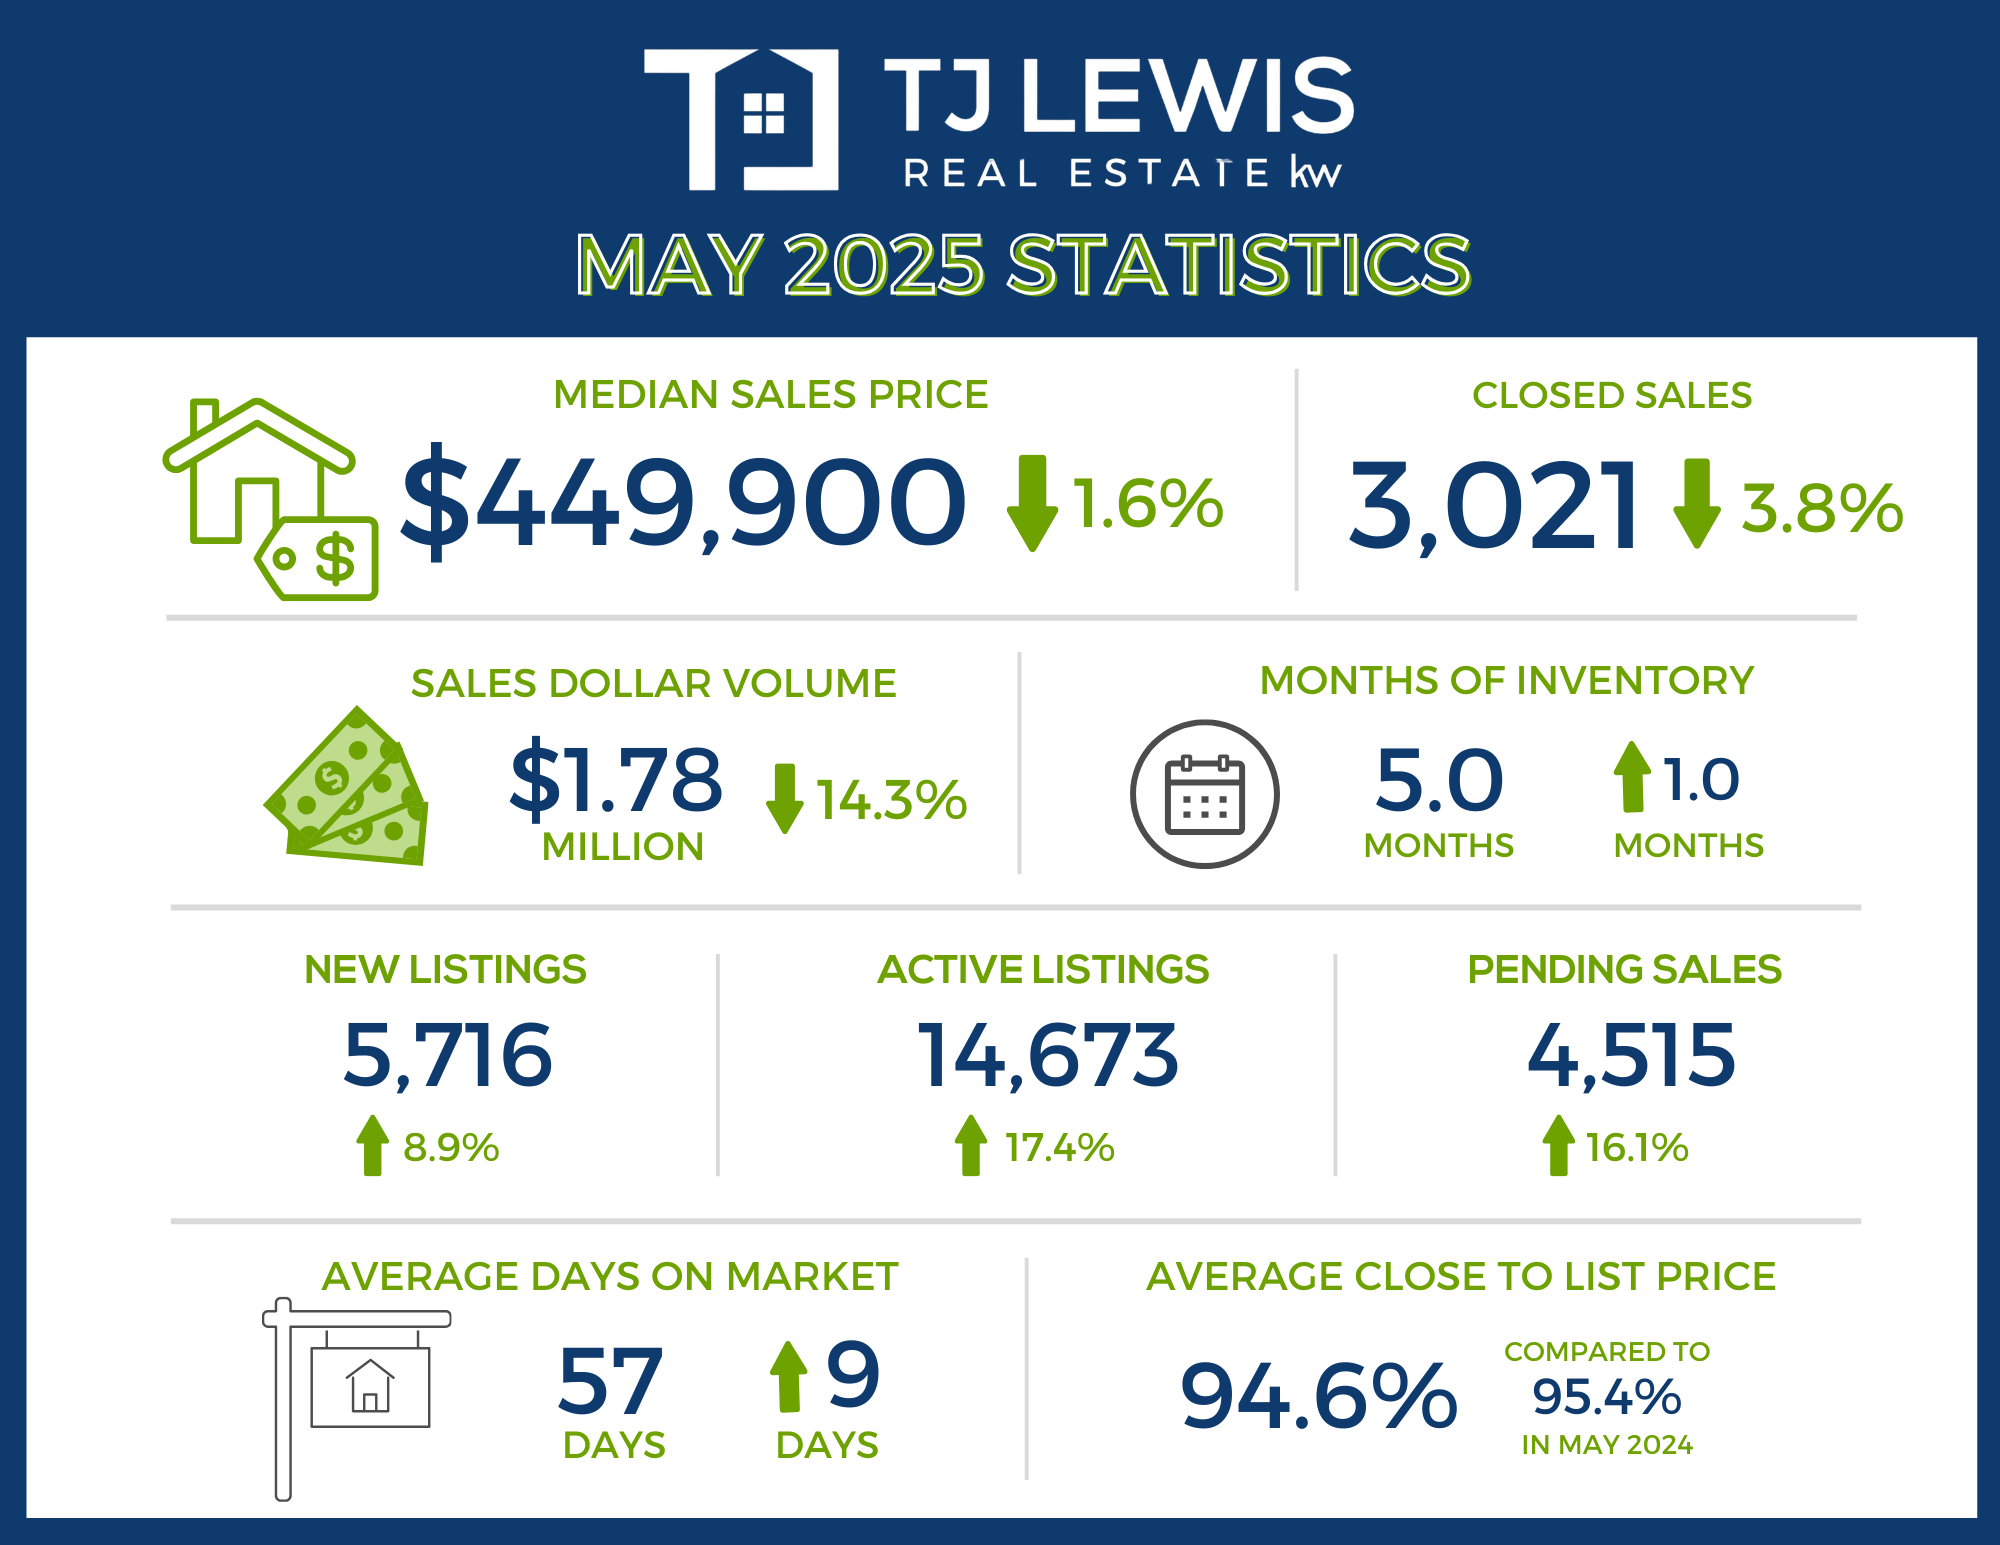
The Central Texas housing market is showing early signs of strength as we head into the summer season. In May, the number of new listings in the Austin-Round Rock-San Marcos area rose 8.9%, reaching 5,716 homes. That growth pushed housing inventory up to 5.0 months, one full month higher than this time last year.
While home sales dipped 3.8% to 3,021, and the median sales price slipped slightly to $449,900, the overall picture is more encouraging than it may seem at first glance. One of the biggest bright spots? Pending sales jumped 16.1% to 4,515—the strongest month so far in 2025.
Clare Knapp, Ph.D., housing economist for Unlock MLS and the Austin Board of REALTORS®, explained what this shift could mean for both buyers and sellers:
"At some point, a slowing market can motivate sellers to adjust prices to better align with what buyers can afford. We're seeing that dynamic begin to unfold in Central Texas. It's not that demand has disappeared—buyers still want homes here, but affordability remains a key factor. Many are waiting for the right opportunity or more favorable pricing. The notable increase in pending sales in May signals that buyer activity has picked up after a challenging first quarter. While higher mortgage rates continue to impact buyer confidence, these trends point to cautious optimism as we move into the summer."
With more homes on the market and buyer interest beginning to rebound, real estate professionals are encouraging clients to take a strategic approach.
Brandy Wuensch, 2025 Unlock MLS and ABoR president, shared her thoughts on the opportunities this market presents:
"We're seeing signs of a bounce-back this month, which is encouraging after a slower start to the year. Buyers and sellers alike should take advantage of this evolving landscape with the help of trusted real estate agents who can help them navigate opportunities and competitive pricing strategies. Central Texas continues to be a place where people want to live, but many are waiting for market conditions that match their financial readiness. Homes priced competitively are still selling well, which underscores the lasting power of homeownership as a tool for long-term financial stability and wealth-building."
As summer approaches, the market appears to be turning a corner. Rising inventory, stronger buyer activity, and pricing adjustments are combining to create a more balanced playing field for both sides of the transaction.
Austin-Round Rock-San Marcos MSA
May 2025 - For Sale
-
3,021 – Residential homes sold, 3.8% less than May 2024.
-
$449,900 – Median price for residential homes, 1.6% less than May 2024.
-
5,716 – New home listings on the market, 8.9% more than May 2024.
-
14,673 – Active home listings on the market, 17.4% more than May 2024.
-
4,515 – Pending sales, 16.1% more than May 2024.
-
5.0 – Months of inventory, 1.0 month more than May 2024.
-
$1,783,631,944 – Total dollar volume of homes sold, 4.3% less than May 2024.
-
94.6% – Average close to list price, compared to 95.4% in May 2024.
May 2025 - For Lease
-
2,327 – Closed leases, 5.9% less than May 2024.
-
$2,295 – Median price for rent, 0.2% less than May 2024.
-
3,878 – New lease listings on the market, 1.5% more than May 2024.
-
4,774 – Active lease listings on the market, 0.5% less than May 2024.
-
2,714 – Pending leases, 1.3% more than May 2024.
-
2.1 – Months of inventory, 0.2 months more than May 2024
-
$4,914,639 – Total dollar volume of leases, 11.9% less than May 2024.
-
97.7% – Average close to list price, compared to 97.4% in May 2024.
City of Austin
May 2025 - For Sale
-
1,027 – Residential homes sold, 5.8% less than May 2024.
-
$595,000 – Median price for residential homes, 2.0% less than May 2024.
-
2,184 – New home listings on the market, 7.9% more than May 2024.
-
5,691 – Active home listings on the market, 17.8% more than May 2024.
-
1,690 – Pending sales, 21.2% more than May 2024.
-
5.7 – Months of inventory, 1.2 months more than May 2024.
-
$820,445,422 – Total dollar volume of homes sold, 4.3% less than May 2024.
-
94.8% – Average close to list price, compared to 95.2% in May 2024.
May 2025 - For Lease
-
1,101 – Closed leases, 5.2% less than May 2024.
-
$2,500 – Median price for rent, flat compared to May 2024.
-
1,853 – New lease listings on the market, 1.9% less than May 2024.
-
2,395 – Active lease listings on the market, 5.2% less than May 2024.
-
1,314 – Pending leases, 1.2% more than May 2024.
-
2.3 – Months of inventory, 0.1 months more than May 2024.
-
$2,785,381 – Total dollar volume of leases, 11.3% less than May 2024.
-
97.1% – Average close to list price, compared to 97.0% in May 2024.
Travis County
May 2025 - For Sale
-
1,328 – Residential homes sold, 3.7% less than May 2024.
-
$525,000 – Median price for residential homes, 5.1% less than May 2024.
-
2,780 – New home listings on the market, 6.4% more than May 2024.
-
7,453 – Active home listings on the market, 16.2% more than May 2024.
-
2,148 – Pending sales, 15.9% more than May 2024.
-
5.8 – Months of inventory, 1.2 months more than May 2024.
-
$971,840,100 – Total dollar volume of homes sold, 4.0% less than May 2024.
-
94.8% – Average close to list price, compared to 95.1% in May 2024.
May 2025 - For Lease
-
1,268 – Closed leases, 3.7% less than May 2024.
-
$2,400 – Median price for rent, 3.0% less than May 2024.
-
2,133 – New lease listings on the market, 0.9% less than May 2024.
-
2,813 – Active lease listings on the market, 3.5% less than May 2024.
-
1,524 – Pending leases, 5.3% more than May 2024.
-
2.3 – Months of inventory, flat compared to May 2024.
-
$3,143,478 – Total dollar volume of leases, 7.9% less than May 2024.
-
97.2% – Average close to list price, compared to 96.9% in May 2024.
Williamson County
May 2025 - For Sale
-
1,024 – Residential homes sold, 3.3% less than May 2024.
-
$425,000 – Median price for residential homes, 2.3% less than May 2024.
-
1,841 – New home listings on the market, 13.6% more than May 2024.
-
4,377 – Active home listings on the market, 26.2% more than May 2024.
-
1,395 – Pending sales, 16.3% more than May 2024.
-
4.4 – Months of inventory, 1.1 months more than May 2024.
-
$495,169,755 – Total dollar volume of homes sold, 5.2% less than May 2024.
-
94.7% – Average close to list price, compared to 96.3% in May 2024.
May 2025 - For Lease
-
818 – Closed leases, 3.7% less than May 2024.
-
$2,200 – Median price for rent, 2.2% less than May 2024.
-
1,349 – New lease listings on the market, 7.7% more than May 2024.
-
1,449 – Active lease listings on the market, 4.9% more than May 2024.
-
921 – Pending leases, 0.5% more than May 2024.
-
1.8 – Months of inventory, 0.2 months more than May 2024.
-
$1,448,013 – Total dollar volume of leases, 12.3% less than May 2024.
-
98.5% – Average close to list price, compared to 98.1% in May 2024.
Hays County
May 2025 - For Sale
-
524 – Residential homes sold, 7.2% more than May 2024.
-
$384,990 – Median price for residential homes, 0.8% less than May 2024.
-
779 – New home listings on the market, 6.1% more than May 2024.
-
1,924 – Active home listings on the market, 4.2% more than May 2024.
-
707 – Pending sales, 18.2% more than May 2024.
-
3.8 – Months of inventory, flat compared to May 2024.
-
$261,580,046 – Total dollar volume of homes sold, 4.1% more than May 2024.
-
94.0% – Average close to list price, compared to 94.7% in May 2024.
May 2025 - For Lease
-
199 – Closed leases, 15.8% less than May 2024.
-
$2,000 – Median price for rent, 9.1% less than May 2024.
-
326 – New lease listings on the market, 5.0% less than May 2024.
-
399 – Active lease listings on the market, 2.0% more than May 2024.
-
219 – Pending leases, 10.2% less than May 2024.
-
2.1 – Months of inventory, 0.4 months more than May 2024.
-
$265,216 – Total dollar volume of leases, 37.0% less than May 2024.
-
98.0% – Average close to list price, compared to 97.3% in May 2024.
Bastrop County
May 2025 - For Sale
-
102 – Residential homes sold, 32.0% less than May 2024.
-
$350,000 – Median price for residential homes, 0.9% more than May 2024.
-
256 – New home listings on the market, 16.9% more than May 2024.
-
740 – Active home listings on the market, 17.6% more than May 2024.
-
214 – Pending sales, 36.3% more than May 2024.
-
7.6 – Months of inventory, 3.3 months more than May 2024.
-
$38,794,606 – Total dollar volume of homes sold, 33.5% less than May 2024.
-
94.0% – Average close to list price, compared to 94.8% in May 2024.
May 2025 - For Lease
-
32 – Closed leases, 37.4% less than May 2024.
-
$2,250 – Median price for rent, 4.7% more than May 2024.
-
55 – New lease listings on the market, 8.3% less than May 2024.
-
85 – Active lease listings on the market, 10.4% more than May 2024.
-
36 – Pending leases, 23.4% less than May 2024.
-
2.7 – Months of inventory, 1.2 months more than May 2024.
-
$55,872 – Total dollar volume of leases, 27.3% less than May 2024.
-
98.7% – Average close to list price, compared to 97.4% in May 2024.
Caldwell County
May 2025 - For Sale
-
43 – Residential homes sold, 32.4% less than May 2024.
-
$317,990 – Median price for residential homes, 8.5% more than May 2024.
-
60 – New home listings on the market, 4.8% less than May 2024.
-
179 – Active home listings on the market, 28.8% more than May 2024.
-
51 – Pending sales, 36.3% less than May 2024.
-
4.3 – Months of inventory, 2.1 months more than May 2024.
-
$16,247,436 – Total dollar volume of homes sold, 18.0% less than May 2024.
-
93.0% – Average close to list price, compared to 96.9% in May 2024.
May 2025 - For Lease
-
10 – Closed leases, 48.5% less than May 2024.
-
$1,750 – Median price for rent, 8.4% less than May 2024.
-
15 – New lease listings on the market, flat compared to May 2024.
-
28 – Active lease listings on the market, 20.0% less than May 2024.
-
14 – Pending leases, 41.7% less than May 2024.
-
2.8 – Months of inventory, 1.0 months more than May 2024.
-
$2,060 – Total dollar volume of leases, 89.4% less than May 2024.
-
97.8% – Average close to list price, compared to 98.1% in May 2024.
For more information or to download the May 2025 Central Texas Housing Market Report, visit UnlockMLS.com/Stats.
Recent Posts