June 2025 Central Texas Housing Market Report

Mid-Year Check-In: Central Texas Market Holding Steady Heading into Summer
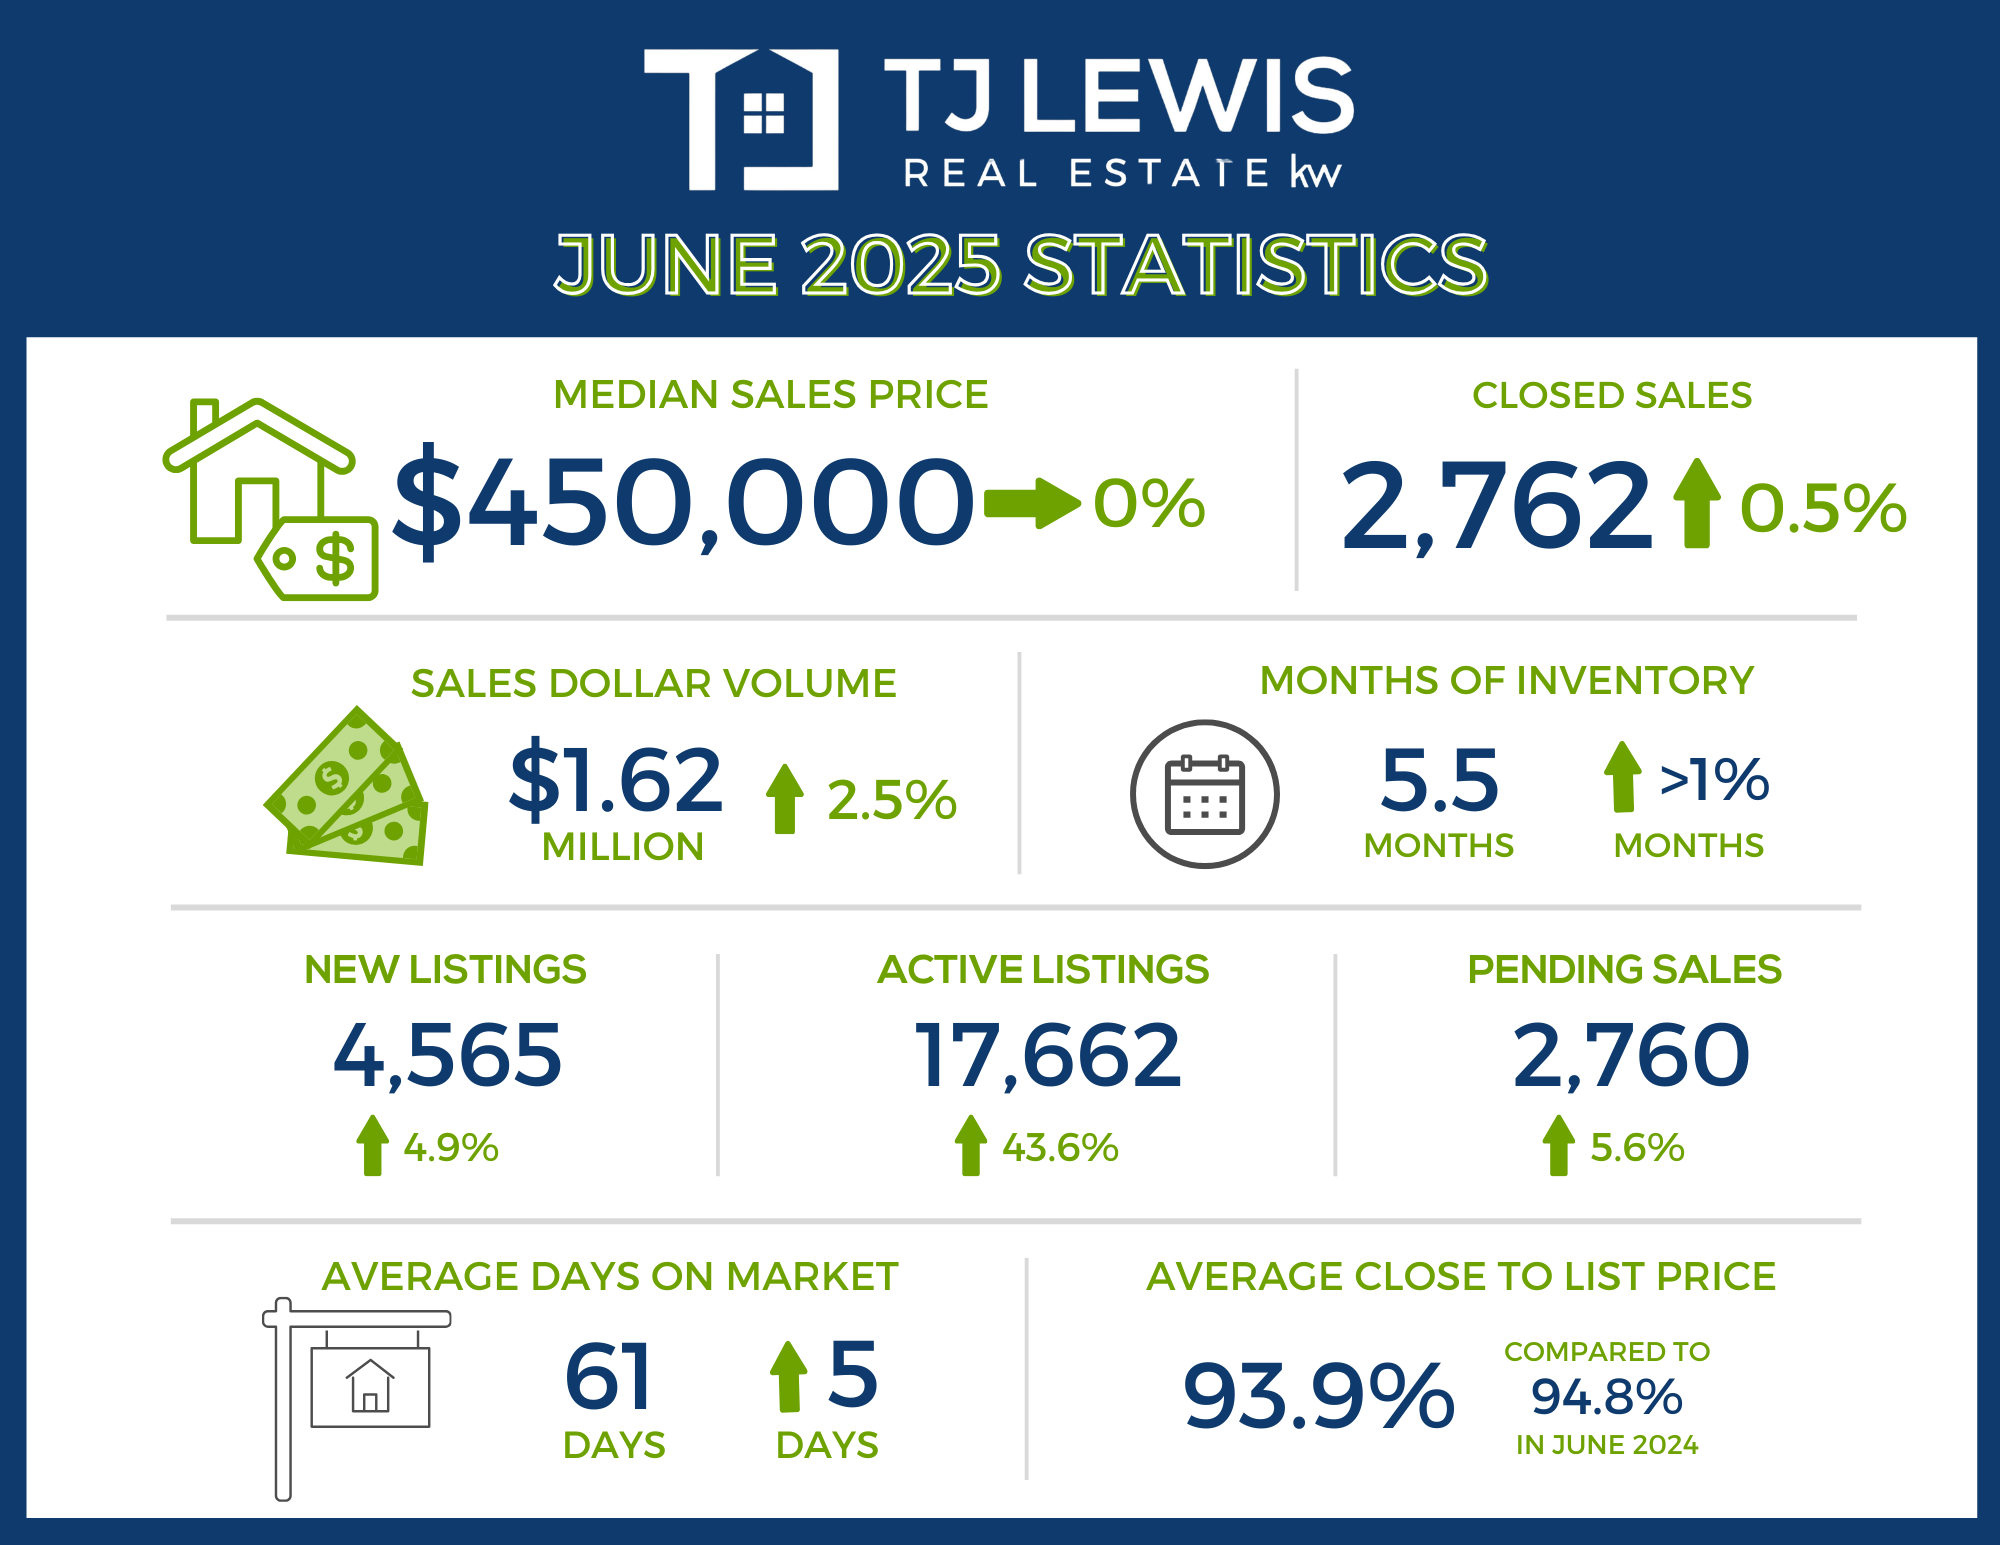
The Central Texas housing market continues to show signs of stability after a slower start to the year. According to the June and Mid-Year 2025 Central Texas Housing Report from Unlock MLS, closed sales across the Austin-Round Rock-San Marcos area ticked up 0.5% in June, reaching 2,762 sales. The median sales price held steady at $450,000.
Looking at the year so far, total closed sales dipped 6.4% to 15,015—a decline that was expected after the economic uncertainty earlier this year. But even with that slower start, the numbers suggest the market is finding its footing.
Vaike O’Grady, research advisor at Unlock MLS, said the latest data points to a steady shift toward balance:
“The Central Texas housing market is continuing a gradual adjustment following a subdued start to the year, with current indicators signaling movement toward a more balanced environment. Although year-to-date sales remain below 2024 levels, the rate of decline has moderated, and rising inventory is expanding buyer choice.”
O’Grady also noted:
“At the same time, the median sales price has held steady, underscoring ongoing demand and reinforcing long-term confidence in the Austin market. Mortgage rates are expected to stay relatively stable, meaning sellers will need to remain flexible on pricing to maintain progress, particularly as affordability remains a significant hurdle for many first-time buyers. With over 15,000 homes sold year to date, the market is potentially positioned to close the gap with last year’s pace if these trends continue.”
As the market continues to normalize, local expertise is proving more important than ever.
Brandy Wuensch, 2025 Unlock MLS and ABoR president, highlighted the important role agents play in today’s market:
“We’ve reached a point in the year where housing market conditions are leveling off, but it’s never been clearer than before that there isn’t a one-size-fits-all approach when it comes to buying or selling a home in Central Texas. Whether it’s helping sellers position their homes competitively or advising buyers on affordability and timing, real estate agents are at the center of the market’s return to balance.”
With more inventory, stable pricing, and steady demand, Central Texas is on track to finish the year with growing confidence and opportunity for those ready to make their move.
Austin-Round Rock-San Marcos MSA
June 2025 Sales
- 2,762 – Residential homes sold, 0.5% more than June 2024.
- $450,000 – Median price for residential homes, flat compared to June 2024.
- 4,565 – New home listings on the market, 4.9% more than June 2024.
- 17,662 – Active home listings on the market, 43.6% more than June 2024.
- 2,760 – Pending sales, 5.6% more than June 2024.
- 5.5 – Months of inventory, 0.7 months more than June 2024.
- $1,620,000,000 – Total dollar volume of homes sold, 2.5% more than June 2024.
- 93.9% – Average close to list price, compared to 94.8% in June 2024.
Year to Date Sales
- 15,015 – Residential homes sold, 6.4% less than the first half of 2024.
- $439,000 – Median price for residential homes, 2.4% less than the first half of 2024.
- 29,868 – New home listings on the market, 8.3% more than the first half of 2024.
- 76,020 – Active home listings on the market, 19.7% more than the first half of 2024.
- 16,626 – Pending sales, 2.8% less than the first half of 2024.
- $8,660,000,000 – Total dollar volume of homes sold, 6.3% less than the first half of 2024.
Year to Date Leases
- 60,240 – Closed leases, 1.9% more than the first half of 2024.
- $2,000 – Median price for rent, 2.4% less than the first half of 2024.
- 101,713 – New lease listings on the market, 11.6% more than the first half of 2024.
- 26,488 – Active lease listings on the market, 3.7% more than the first half of 2024.
- 98,595 – Pending leases, 11.4% more than the first half of 2024.
- $13,351,000 – Total dollar volume of leases, 2.6% more than the first half of 2024.
City of Austin
June 2025 Sales
- 961 – Residential homes sold, 10.8% more than June 2024.
- $590,000 – Median price for residential homes, flat compared to June 2024.
- 1,721 – New home listings on the market, 4.2% more than June 2024.
- 5,542 – Active home listings on the market, 86.9% more than June 2024.
- 918 – Pending sales, 5.8% more than June 2024.
- 5.7 – Months of inventory, 1.6 months more than June 2024.
- $756,360,000 – Total dollar volume of homes sold, 14.6% more than June 2024.
- 93.8% – Average close to list price, compared to 94.3% in June 2024.
Year to Date Sales
- 5,122 – Residential homes sold, 5.7% less than the first half of 2024.
- $579,000 – Median price for residential homes, 0.7% more than the first half of 2024.
- 11,384 – New home listings on the market, 10.7% more than the first half of 2024.
- 28,243 – Active home listings on the market, 20.4% more than the first half of 2024.
- 5,634 – Pending sales, 2.2% less than the first half of 2024.
- $3,950,000,000 – Total dollar volume of homes sold, 3.4% less than the first half of 2024.
Year to Date Leases
- 8,253 – Closed leases, 0.2% less than the first half of 2024.
- $2,300 – Median price for rent, 2.1% less than the first half of 2024.
- 11,422 – New lease listings on the market, 2.1% less than the first half of 2024.
- 13,158 – Active lease listings on the market, 4.1% less than the first half of 2024.
- 10,824 – Pending leases, 2.8% more than the first half of 2024.
- $22,040,000 – Total dollar volume of leases, 0.2% less than the first half of 2024.
Travis County
June 2025 Sales
- 1,238 – Residential homes sold, 2.1% more than June 2024.
- $525,000 – Median price for residential homes, 1.0% more than June 2024.
- 5,280 – New home listings on the market, 4.3% more than June 2024.
- 7,284 – Active home listings on the market, 18.8% more than June 2024.
- 3,174 – Pending sales, 5.0% more than June 2024.
- 5.8 – Months of inventory, 0.3 more than June 2024.
- $899,512,178 – Total dollar volume of homes sold, 6.8% more than June 2024.
- 93.9% – Average close to list price, compared to 94.8% in June 2024.
Year to Date Sales
- 6,717 – Residential homes sold, 6.3% less than the first half of 2024.
- $510,000 – Median price for residential homes, 1.9% less than the first half of 2024.
- 14,604 – New home listings on the market, 9.2% more than the first half of 2024.
- 37,482 – Active home listings on the market, 17.9% more than the first half of 2024.
- 7,340 – Pending sales, 3.7% less than the first half of 2024.
- $4,750,000,000 – Total dollar volume of homes sold, 5.2% less than the first half of 2024.
Year to Date Leases
- 9,320 – Closed leases, 1.0% more than the first half of 2024.
- $2,250 – Median price for rent, 2.2% less than the first half of 2024.
- 12,828 – New lease listings on the market, 1.5% less than the first half of 2024.
- 15,541 – Active lease listings on the market, 0.9% less than the first half of 2024.
- 12,282 – Pending leases, 4.2% more than the first half of 2024.
- $24,630,000 – Total dollar volume of leases, 0.9% more than the first half of 2024.
Williamson County
June 2025 Sales
- 909 – Residential homes sold, 4.9% less than June 2024.
- $425,000 – Median price for residential homes, 2.3 less than June 2024.
- 1,433 – New home listings on the market, 5.9% more than June 2024.
- 4,427 – Active home listings on the market, 31.4% more than June 2024.
- 943 – Pending sales, 1.7% more than June 2024.
- 4.8 – Months of inventory, 0.9 more than June 2024.
- $445,600,000 – Total dollar volume of homes sold, 7.0% less than June 2024.
- 94.1% – Average close to list price, compared to 95.5% in June 2024.
Year to Date Sales
- 5,068 – Residential homes sold, 8.3% less than the first half of 2024.
- $420,000 – Median price for residential homes, 2.3% less than the first half of 2024.
- 9,177 – New home listings on the market, 9.7% more than the first half of 2024.
- 22,619 – Active home listings on the market, 27.2% more than the first half of 2024.
- 5,596 – Pending sales, 4.7% less than the first half of 2024.
- $2,430,000,000 – Total dollar volume of homes sold, 9.5% less than the first half of 2024.
Year to Date Leases
- 5,097 – Closed leases, 0.4% more than the first half of 2024.
- $2,145 – Median price for rent, 2.5% less than the first half of 2024.
- 7,057 – New lease listings on the market, 6.8% more than the first half of 2024.
- 7,910 – Active lease listings on the market, 11.2% more than the first half of 2024.
- 6,435 – Pending leases, 7.2% more than the first half of 2024.
- $11,230,000 – Total dollar volume of leases, 1.9% less than the first half of 2024.
Hays County
June 2025 Sales
- 462 – Residential homes sold, 19.1% more than June 2024.
- $369,990 – Median price for residential homes, 5.5% less than June 2024.
- 691 – New home listings on the market, 10.7% more than June 2024.
- 1,976 – Active home listings on the market, 2.3% more than June 2024.
- 433 – Pending sales, 11.6% more than June 2024.
- 4.1 – Months of inventory, 0.9 months less than June 2024.
- $224,000,000 – Total dollar volume of homes sold, 6.8% more than June 2024.
- 93.5% – Average close to list price, compared to 94.9% in June 2024.
Year to Date Sales
- 2,346 – Residential homes sold, 0.2% more than the first half of 2024.
- $374,610 – Median price for residential homes, 2.7% less than the first half of 2024.
- 4,186 – New home listings on the market, 6.5% more than the first half of 2024.
- 10,881 – Active home listings on the market, 11.4% more than the first half of 2024.
- 2,679 – Pending sales, 6.2% more than the first half of 2024.
- $1,140,000,000 – Total dollar volume of homes sold, 1.5% less than the first half of 2024.
Year to Date Leases
- 1,453 – Closed leases, 0.1% less than the first half of 2024.
- $1,995 – Median price for rent, 5.0% less than the first half of 2024.
- 1,981 – New lease listings on the market, 5.1% more than the first half of 2024.
- 2,383 – Active lease listings on the market, 14.6% more than the first half of 2024.
- 1,875 – Pending leases, 8.3% more than the first half of 2024.
- $3,130,000 – Total dollar volume of leases, 4.1% less than the first half of 2024.
Bastrop County
June 2025 Sales
- 118 – Residential homes sold, 10.3% more than June 2024.
- $375,000 – Median price for residential homes, 10.7% more than June 2024.
- 204 – New home listings on the market, 3.0% more than June 2024.
- 868 – Active home listings on the market, 25.4% more than June 2024.
- 123 – Pending sales, 7.9% more than June 2024.
- 6.9 – Months of inventory, 1.1 months more than June 2024.
- $50,330,000 – Total dollar volume of homes sold, 23.4% more than June 2024.
- 95.1% – Average close to list price, compared to 94.4% in June 2024.
Year to Date Sales
- 665 – Residential homes sold, 9.6% less than the first half of 2024.
- $350,000 – Median price for residential homes, 0.8% less than the first half of 2024.
- 1,354 – New home listings on the market, 3.0% more than the first half of 2024.
- 4,070 – Active home listings on the market, 23.8% more than the first half of 2024.
- 771 – Pending sales, 0.3% less than the first half of 2024.
- $267,370,000 – Total dollar volume of homes sold, 8.7% less than the first half of 2024.
Year to Date Leases
- 287 – Closed leases, 1.4% less than the first half of 2024.
- $1,950 – Median price for rent, flat compared to the first half of 2024.
- 441 – New lease listings on the market, 15.7% more than the first half of 2024.
- 475 – Active lease listings on the market, 2.2% more than the first half of 2024.
- 397 – Pending leases, 9.4% more than the first half of 2024.
- $576,660 – Total dollar volume of leases, 1.2% less than the first half of 2024.
Caldwell County
June 2025 Sales
- 35 – Residential homes sold, 31.4% less than June 2024.
- $290,000 – Median price for residential homes, 3.7% less than June 2024.
- 43 – New home listings on the market, 28.3% less than June 2024.
- 208 – Active home listings on the market, 16.2% more than June 2024.
- 47 – Pending sales, 56.7% more than June 2024.
- 6.1 – Months of inventory, 2.6 months more than June 2024.
- $10,830,000 – Total dollar volume of homes sold, 37.9% less than June 2024.
- 91.0% – Average close to list price, compared to 96.4% in June 2024.
Year to Date Sales
- 219 – Residential homes sold, 20.4% less than the first half of 2024.
- $299,990 – Median price for residential homes, 0.7% less than the first half of 2024.
- 365 – New home listings on the market, 14.3% less than the first half of 2024.
- 971 – Active home listings on the market, 11.0% more than the first half of 2024.
- 240 – Pending sales, 22.1% less than the first half of 2024.
- $70,810,000 – Total dollar volume of homes sold, 26.0% less than the first half of 2024.
Year to Date Leases
- 131 – Closed leases, 7.1% less than the first half of 2024.
- $1,700 – Median price for rent, 2.9% less than the first half of 2024.
- 178 – New lease listings on the market, 7.9% more than the first half of 2024.
- 179 – Active lease listings on the market, 11.8% less than the first half of 2024.
- 152 – Pending leases, 9.5% less than the first half of 2024.
- $214,060 – Total dollar volume of leases, 9.3% less than the first half of 2024.
Recent Posts