August 2026 Central Texas Housing Report
Central Texas Housing Market Adjusts as Buyers Navigate Changing Economic Conditions
After building momentum through the first half of 2026, the Central Texas housing market showed signs of adjustment in August as buyers continued to navigate higher interest rates and broader economic uncertainty.
Residential home sales across the Austin-Round Rock-San Marcos MSA declined 7.3% year over year to 2,501 sales. On the surface, that looks like a step backward. But another important number tells a different part of the story: pending sales increased 1.5% year over year to 2,623 transactions.
That difference matters.
Closed sales tell us what happened. Pending sales give us a better look at what buyers are doing right now. While higher rates and economic uncertainty are keeping some buyers on the sidelines, there are still buyers actively moving forward.
“Austin is not immune to what is happening across the rest of the country, and August’s housing data reflects some of the same affordability and interest rate pressures we’re seeing nationwide,” Vaike O’Grady, market research advisor at Unlock MLS, said. “Still, Austin is resilient. Central Texas continues to see economic development and job growth across the region. Higher interest rates mean fewer potential buyers, but positive pending sales and continued building activity show the market is still moving. Continued job creation and business growth across the region remain important signals of the underlying strength supporting Central Texas housing.”
Buyers Are Still Buying—But They're Being More Selective
This is an important distinction for both buyers and sellers.
Earlier this year, we saw signs that buyers were becoming more comfortable reentering the market. August suggests that the current economic environment is making some of those buyers slow down, reassess, or become more selective.
That doesn't mean demand has disappeared.
It means the decision to buy has to make sense.
Higher interest rates directly affect affordability, and when combined with other economic pressures, they can make buyers more cautious about the price they are willing to pay and the monthly payment they are willing to take on.
For sellers, that creates an important reality: having a home on the market is not enough.
Today's buyers have options, and they are paying attention to value. Pricing, condition, location and overall affordability all matter when buyers are deciding which homes deserve their attention.
The Market Is Adjusting, Not Standing Still
August is also a good reminder that the housing market doesn't move in a straight line.
We entered 2026 with increasing buyer activity, and the first half of the year showed meaningful improvement in sales and pending transactions. Now we're seeing some of that momentum level off as economic conditions put additional pressure on affordability.
That's normal in a market that's still finding its balance.
John Crowe, 2026 Unlock MLS and ABoR president, said shifts in market activity are normal, but changing conditions make local expertise especially important for buyers and sellers.
“The ebbs and flows we’re seeing are normal in a changing housing market, but knowing what those shifts mean for you is where a trusted real estate professional makes a difference. Is this the right time to list your home? Should I buy, or should I rent? An agent who subscribes to Unlock MLS can take complete market data, pair it with your needs and cost requirements, and help you make the decision that puts you in the best possible position. That kind of straightforward guidance is critical to knowing you made the right decision.”
And that's probably the biggest takeaway from August.
The Central Texas market isn't defined by one month's sales number. It's a market where buyers have more time to think, sellers have to compete for attention, and economic conditions can quickly change the equation.
For buyers, that means there may be opportunities worth exploring—but the numbers have to work for your situation. For sellers, it means strategy matters more than simply putting a sign in the yard and waiting for a buyer.
The market is still moving. It's just becoming increasingly important to understand how it's moving and what that means for your specific situation.
That's where good real estate advice matters most: not telling you that it's always the right time to buy or sell, but helping you determine whether it's the right time for you.
Austin-Round Rock-San Marcos MSA
August 2026 - For Sale
-
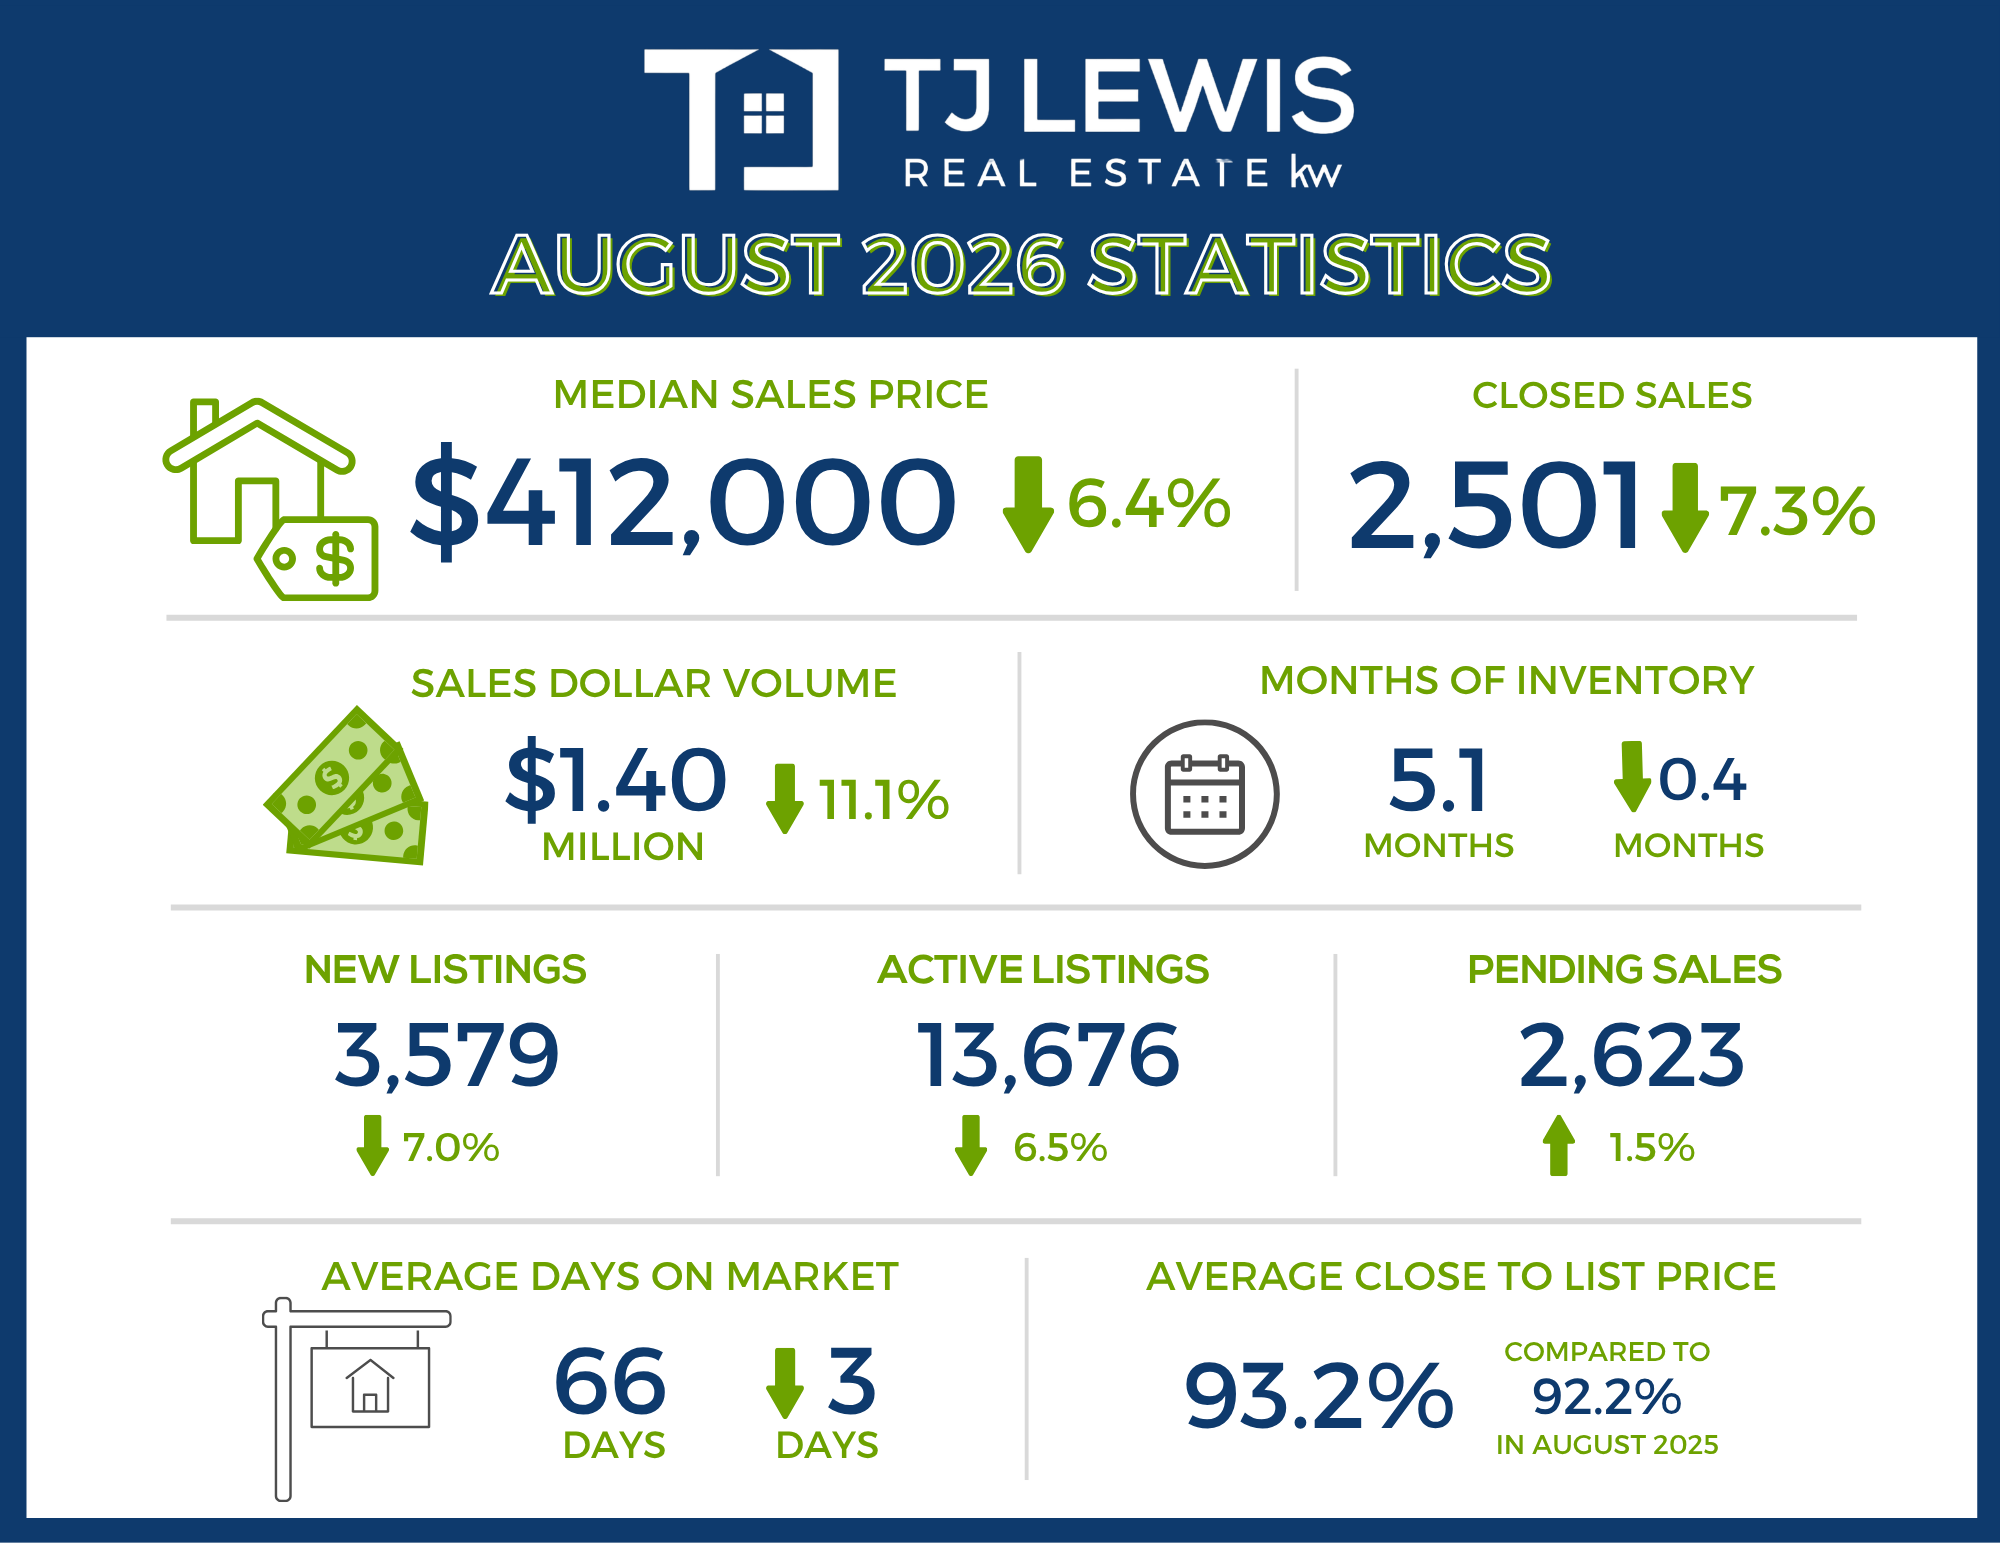
2,501 – Residential homes sold, 7.3% less than August 2025.
-
$412,000 – Median price for residential homes, 6.4% less than August 2025.
-
3,579 – New home listings on the market, 7.0% less than August 2025.
-
13,676 – Active home listings on the market, 6.5% less than August 2025.
-
2,623 – Pending sales, 1.5% more than August 2025.
-
5.1 – Months of inventory, 0.4 less than August 2025.
-
$1,400,025,097 – Total dollar volume of homes sold, 11.1% less than August 2025.
-
93.2% – Average close to list price, compared to 92.2% in August 2025.
August 2026 - For Lease
-
2,920 – Closed leases, 6.2% less than August 2025.
-
$2,150 – Median price for rent, flat compared to August 2025.
-
3,330 – New lease listings on the market, 10.5% less than August 2025.
-
4,296 – Active lease listings on the market, 27.9% less than August 2025.
-
2,852 – Pending sales, 0.4% less than August 2025.
-
1.6 – Months of inventory, 0.7 months less than August 2025.
-
$7,067,966 – Total dollar volume of leases, 6.7% less than August 2025.
-
96.8% – Average close to list price, compared to 95.7% in August 2025.
City of Austin
August 2026 - For Sale
-
844 – Residential homes sold, 10.3% less than August 2025.
-
$560,000 – Median price for residential homes, 4.3% less than August 2025.
-
1,249 – New home listings on the market, 5.7% less than August 2025.
-
4,554 – Active home listings on the market, 14.5% less than August 2025.
-
814 – Pending sales, 9.2% less than August 2025.
-
4.6 – Months of inventory, 1.1 less than August 2025.
-
$648,959,724 – Total dollar volume of homes sold, 10.9% less than August 2025.
-
93.3% – Average close to list price, compared to 91.6% in August 2025.
August 2026 - For Lease
-
1,601 – Closed leases, 3.7% less than August 2025.
-
$2,200 – Median price for rent, 4.3% less than August 2025.
-
1,711 – New lease listings on the market, 9.0% less than August 2025.
-
2,005– Active lease listings on the market, 28.8% less than August 2025.
-
1,535 – Pending sales, 1.1% more than August 2025.
-
1.5 – Months of inventory, 0.7 months less than August 2025.
-
$4,149,623 – Total dollar volume of leases, 5.4% less than August 2025.
-
96.1% – Average close to list price, compared to 95.3% in August 2025.
Travis County
August 2026 - For Sale
-
1,111 – Residential homes sold, 9.5% less than August 2025.
-
$489,000 – Median price for residential homes, 6.4% less than August 2025.
-
1,703 – New home listings on the market, 7.6% less than August 2025.
-
6,427 – Active home listings on the market, 10.2% less than August 2025.
-
1,136 – Pending sales, 1.1% less than August 2025.
-
5.1 – Months of inventory, 0.8 months less than August 2025.
-
$780,140,633 – Total dollar volume of homes sold, 11.6% less than August 2025.
-
93.2% – Average close to list price, compared to 91.6% in August 2025.
August 2026 - For Lease
-
1,784 – Closed leases, 2.8% less than August 2025.
-
$2,200 – Median price for rent, 2.2% less than August 2025.
-
1,959 – New lease listings on the market, 7.8% less than August 2025.
-
2,464 – Active lease listings on the market, 25.4% less than August 2025.
-
1,743 – Pending sales, 3.1% more than August 2025.
-
1.6 – Months of inventory, 0.6 months less than August 2025.
-
$4,568,164 – Total dollar volume of leases, 4.6% less than August 2025.
-
96.3% – Average close to list price, compared to 95.3% in August 2025.
Williamson County
August 2026 - For Sale
-
855 – Residential homes sold, 4.1% less than August 2025.
-
$399,900 – Median price for residential homes, 5.9% less than August 2025.
-
1,151 – New home listings on the market, 9.2% less than August 2025.
-
4,374 – Active home listings on the market, 5.4% less than August 2025.
-
960 – Pending sales, 9.3% more than August 2025.
-
4.6 – Months of inventory, 0.6 months less than August 2025.
-
$394,667,779 – Total dollar volume of homes sold, 8.7% less than August 2025.
-
93.6% – Average close to list price, compared to 93.1% in August 2025.
August 2026 - For Lease
-
828 – Closed leases, 14.4% less than August 2025.
-
$2,150 – Median price for rent, 1.4% more than August 2025.
-
992 – New lease listings on the market, 13.7% less than August 2025.
-
1,268 – Active lease listings on the market, 35.1% less than August 2025.
-
807 – Pending sales, 9.0% less than August 2025.
-
1.5 – Months of inventory, 0.7 months less than August 2025.
-
$1,841,684 – Total dollar volume of leases, 13.5% less than August 2025.
-
97.8% – Average close to list price, compared to 96.1% in August 2025.
Hays County
August 2026 - For Sale
-
396 – Residential homes sold, 8.1% less than August 2025.
-
$355,000 – Median price for residential homes, 1.4% less than August 2025.
-
493 – New home listings on the market, flat compared to August 2025.
-
1,860 – Active home listings on the market, 1.7% less than August 2025.
-
346 – Pending sales, 13.5% less than August 2025.
-
5.5 – Months of inventory, 1.0 months more than August 2025.
-
$173,376,257 – Total dollar volume of homes sold, 15.8% less than August 2025.
-
93.0% – Average close to list price, compared to 92.1% to August 2025.
August 2026 - For Lease
-
227 – Closed leases, 3.7% more than August 2025.
-
$2,000 – Median price for rent, flat compared to August 2025.
-
274 – New lease listings on the market, 16.0% less than August 2025.
-
435 – Active lease listings on the market, 21.6% less than August 2025.
-
214 – Pending sales, 4.4% more than August 2025.
-
1.7 – Months of inventory, flat compared to August 2025.
-
$501,746 – Total dollar volume of leases, 2.2% more than August 2025.
-
97.4% – Average close to list price, compared to 96.3% in August 2025.
Bastrop County
August 2026 - For Sale
-
98 – Residential homes sold, 14.8% less than August 2025.
-
$342,495 – Median price for residential homes, 5.1% less than August 2025.
-
170 – New home listings on the market, 13.3% less than August 2025.
-
759 – Active home listings on the market, 4.9% less than August 2025.
-
134 – Pending sales, 8.9% more than August 2025.
-
7.4 – Months of inventory, 0.3 months less than August 2025.
-
$39,235,909 – Total dollar volume of homes sold, 11.4% less than August 2025.
-
91.8% – Average close to list price, compared to 91.5% in August 2025.
August 2026 - For Lease
-
62 – Closed leases, 1.6% less than August 2025.
-
$1,950 – Median price for rent, 1.3% more than August 2025.
-
78 – New lease listings on the market, 4.9% less than August 2025.
-
97 – Active lease listings on the market, 11.0% less than August 2025.
-
70 – Pending sales, 27.3% more than August 2025.
-
1.9 – Months of inventory, 0.3 months less than August 2025.
-
$125,278 – Total dollar volume of leases, 0.7% more than August 2025.
-
97.2% – Average close to list price, compared to 98.1% in August 2025.
Caldwell County
August 2026 - For Sale
-
41 – Residential homes sold, 24.2% more than August 2025.
-
$270,000 – Median price for residential homes, 17.4% more than August 2025.
-
62 – New home listings on the market, 31.9% more than August 2025.
-
256 – Active home listings on the market, 62.0% more than August 2025.
-
47 – Pending sales, 34.3% more than August 2025.
-
7.3 – Months of inventory, 2.0 months more than August 2025.
-
$12,604,519– Total dollar volume of homes sold, 43.0% more than August 2025.
-
92.8% – Average close to list price, compared to 88.6% in August 2025.
August 2026 - For Lease
-
19 – Closed leases, 34.5% less than August 2025.
-
$1,600 – Median price for rent, 5.9% less than August 2025.
-
27 – New lease listings on the market, 28.9% less than August 2025.
-
32 – Active lease listings on the market, 17.9% less than August 2025.
-
18 – Pending sales, 28.0% less than August 2025.
-
2.9 – Months of inventory, flat compared to August 2025.
-
$31,094 – Total dollar volume of leases, 32.5% less than August 2025.
-
97.7% – Average close to list price, compared to 94.1% in August 2025.
Recent Posts