September 2026 Central Texas Housing Report
Central Texas Housing Market Adjusts Amid Challenging Economic Conditions
After building momentum earlier in 2026, the Central Texas housing market faced renewed pressure in September as rising mortgage rates made homeownership more expensive.
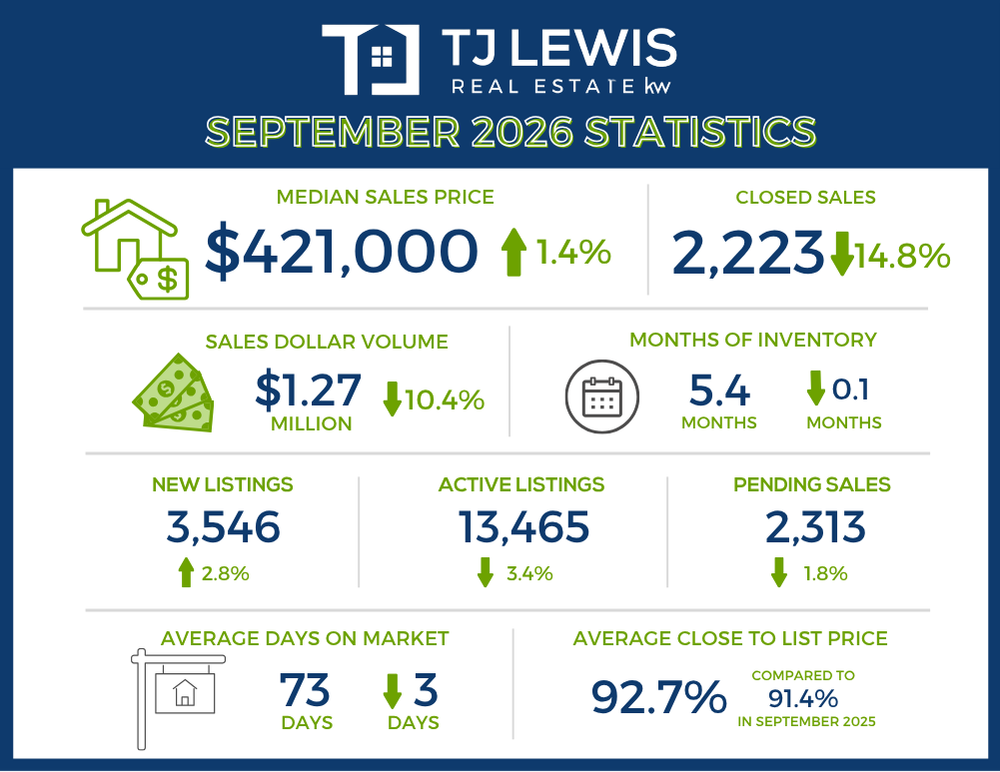
Closed sales across the Austin-Round Rock-San Marcos MSA declined 14.8% year over year to 2,223 sales, while the median sales price increased 1.4% to $421,000. Pending sales declined just 1.8% to 2,313, suggesting buyers are still moving forward, even as affordability challenges force some to reconsider their options.
The difference between closed and pending sales matters. Closed sales show what has already happened, while pending sales offer a glimpse of current buyer activity. September was a slower month, but the market hasn't stopped moving.
Higher Rates Are Changing Buyer Decisions
Vaike O’Grady, research advisor at Unlock MLS, said September’s slowdown reflects a shift in market activity following the recent increase in mortgage rates.
“September's decline in closed sales is significant, and it shows just how sensitive today's housing market is to changes in mortgage rates. We had been seeing steady activity, but the recent increase in rates created another hurdle for buyers, especially those trying to enter the market for the first time. The biggest factor for many buyers isn't necessarily the price of the home, but what that price means for their monthly payment at today's rates. While affordability remains a real challenge, we're still seeing activity in the market. The question now is how buyers and sellers respond to these conditions in the months ahead.”
For buyers, the monthly payment is often the deciding factor—not just the price on the listing. For sellers, that means pricing and positioning matter. Buyers need to see value, and homes that don't align with current market expectations may struggle to attract offers.
There is one encouraging sign: homes closed at an average of 92.7% of their original list price, compared to 91.4% a year earlier. That suggests buyers and sellers are coming closer together on price when transactions get across the finish line.
The Third Quarter Provides More Context
September's decline was sharper than the broader quarterly trend. During the third quarter, closed sales declined 2.4% year over year to 7,748, while the median sales price decreased 2.3% to $420,000.
That contrast is important. One difficult month doesn't necessarily define the market, and the quarterly numbers show a more moderate decline in sales activity. Still, higher rates are creating real pressure, and buyers and sellers need to account for today's conditions rather than rely on what the market looked like earlier this year.
John Crowe, 2026 Unlock MLS and ABoR president, emphasized the importance of understanding local market conditions and working with a real estate professional when making buying or selling decisions.
“It's easy to look at a headline about declining sales or rising mortgage rates and feel discouraged, but every buyer and seller is in a different position. What's happening across the broader market may look very different depending on the neighborhood, price point or type of home you're considering. That's where working with a knowledgeable real estate agent can make a real difference. They can help you identify opportunities that fit your needs and make informed decisions based on your goals rather than trying to predict what the market will do next.”
Make the Decision That Fits Your Situation
September is a reminder that the housing market doesn't move in a straight line. Higher rates have slowed activity, but buyers are still engaged, and local conditions can vary significantly from one neighborhood to another.
For buyers, the focus should be on finding a home and payment that make sense for your finances. For sellers, success starts with understanding what buyers are willing to pay in today's market.
The goal isn't to predict the perfect time to buy or sell. It's to understand your options, weigh the trade-offs, and make a smart decision for your situation. Sometimes that means moving forward. Sometimes it means waiting. The right decision is the one that puts you in the best position—not the one dictated by a market headline.
Austin-Round Rock-San Marcos MSA
Q3 2026 - For Sale
-
7,748 – Residential homes sold, 2.4% less than Q3 2025.
-
$420,000 – Median price for residential homes, 2.3% less than Q3 2025.
-
11,604 – New home listings on the market, 0.8% less than Q3 2025.
-
43,280 – Active home listings on the market, 1.8% less than Q3 2025.
-
7,532 – Pending sales, 1.7% less than Q3 2025.
-
$4,420,180,359 – Total dollar volume of homes sold, 1.7% less than Q3 2025.
-
93.2% – Average close to list price, compared to 92.2% in Q3 2025.
September 2026 - For Sale
-
2,223 – Residential homes sold, 14.8% less than September 2025.
-
$421,000 – Median price for residential homes, 1.4% more than September 2025.
-
3,546 – New home listings on the market, 2.8% more than September 2025.
-
13,465 – Active home listings on the market, 3.4% less than September 2025.
-
2,313 – Pending sales, 1.8% less than September 2025.
-
5.4 – Months of inventory, 0.1 less than September 2025.
-
$1,271,826,054 – Total dollar volume of homes sold, 10.4% less than September 2025.
-
92.7% – Average close to list price, compared to 91.4% in September 2025.
September 2026 - For Lease
-
2,242 – Closed leases, 10.0% less than September 2025.
-
$2,100 – Median price for rent, 2.3% less than September 2025.
-
2,798 – New lease listings on the market, 16.9% less than September 2025.
-
4,370 – Active lease listings on the market, 27.6% less than September 2025.
-
2,392 – Pending sales, 2.6% less than September 2025.
-
1.8 – Months of inventory, 1.1 months less than September 2025.
-
$5,185,810 – Total dollar volume of leases, 13.2% less than September 2025.
-
95.9% – Average close to list price, compared to 94.5% in September 2025.
City of Austin
September 2026 - For Sale
-
777 – Residential homes sold, 12.7% less than September 2025.
-
$570,958 – Median price for residential homes, 4.2% more than September 2025.
-
1,295 – New home listings on the market, 1.1% less than September 2025.
-
4,502 – Active home listings on the market, 10.3% less than September 2025.
-
743 – Pending sales, 8.6% less than September 2025.
-
5.4 – Months of inventory, 0.3 less than September 2025.
-
$604,776,986 – Total dollar volume of homes sold, 5.2% less than September 2025.
-
92.5% – Average close to list price, compared to 90.8% September 2025.
September 2026 - For Lease
-
1,170 – Closed leases, 10.1% less than September 2025.
-
$2,195 – Median price for rent, 4.4% less than September 2025.
-
1,382 – New lease listings on the market, 25.4% less than September 2025.
-
2,014 – Active lease listings on the market, 31.7% less than September 2025.
-
1,227 – Pending sales, 1.0% less than September 2025.
-
1.7 – Months of inventory, 1.2 months less than September 2025.
-
$2,855,228 – Total dollar volume of leases, 16.3% less than September 2025.
-
95.4% – Average close to list price, compared to 94.1% in September 2025.
Travis County
September 2026 - For Sale
-
1,031 – Residential homes sold, 9.6% less than September 2025.
-
$497,400 – Median price for residential homes, 2.6% more than September 2025.
-
1,710 – New home listings on the market, 0.9% less than September 2025.
-
6,360 – Active home listings on the market, 6.1% less than September 2025.
-
1,043 – Pending sales, 3.1% less than September 2025.
-
5.8 – Months of inventory, 0.2 months less than September 2025.
-
$715,993,294 – Total dollar volume of homes sold, 4.6% less than September 2025.
-
92.5% – Average close to list price, compared to 90.8% in September 2025.
September 2026 - For Lease
-
1,364 – Closed leases, 6.6% less than September 2025.
-
$2,175 – Median price for rent, 3.3% less than September 2025.
-
1,589 – New lease listings on the market, 22.3% less than September 2025.
-
2,471 – Active lease listings on the market, 28.1% less than September 2025.
-
1,407 – Pending sales, 1.7% more than September 2025.
-
1.8 – Months of inventory, 1.1 months less than September 2025.
-
$3,303,730 – Total dollar volume of leases, 12.6% less than September 2025.
-
95.5% – Average close to list price, compared to 94.3% in September 2025.
Williamson County
September 2026 - For Sale
-
765 – Residential homes sold, 12.1% less than September 2025.
-
$395,000 – Median price for residential homes, 2.5% less than September 2025.
-
1,078 – New home listings on the market, 7.7% more than September 2025.
-
4,249 – Active home listings on the market, 2.8% less than September 2025.
-
784 – Pending sales, 3.4% less than September 2025.
-
5.0 – Months of inventory, 0.1 months less than September 2025.
-
$346,377,123 – Total dollar volume of homes sold, 15.0% less than September 2025.
-
93.0% – Average close to list price, compared to 91.9% in September 2025.
September 2026 - For Lease
-
611 – Closed leases, 20.4% less than September 2025.
-
$2,100 – Median price for rent, 0.2% more than September 2025.
-
877 – New lease listings on the market, 9.7% less than September 2025.
-
1,336 – Active lease listings on the market, 29.9% less than September 2025.
-
713 – Pending sales, 11.3% less than September 2025.
-
1.8 – Months of inventory, 0.9 months less than September 2025.
-
$1,325,688 – Total dollar volume of leases, 20.3% less than September 2025.
-
96.5% – Average close to list price, compared to 94.6% in September 2025.
Hays County
September 2026 - For Sale
-
294 – Residential homes sold, 30.5% less than September 2025.
-
$399,900 – Median price for residential homes, 10.8% more than September 2025.
-
498 – New home listings on the market, 12.4% more than September 2025.
-
1,898 – Active home listings on the market, 4.9% more than September 2025.
-
323 – Pending sales, 1.8% less than September 2025.
-
4.8 – Months of inventory, 0.4 months more than September 2025.
-
$160,099,822 – Total dollar volume of homes sold, 17.5% less than September 2025.
-
93.2% – Average close to list price, compared to 92.2% September 2025.
September 2026 - For Lease
-
185 – Closed leases, 3.6% less than September 2025.
-
$1,995 – Median price for rent, flat compared to September 2025.
-
252 – New lease listings on the market, 2.7% less than September 2025.
-
440 – Active lease listings on the market, 19.6% less than September 2025.
-
188 – Pending sales, 5.5% less than September 2025.
-
2.1 – Months of inventory, 0.5 months less than September 2025.
-
$401,491 – Total dollar volume of leases, 2.6% less than September 2025.
-
96.2% – Average close to list price, compared to 94.7% in September 2025.
Bastrop County
September 2026 - For Sale
-
105 – Residential homes sold, 21.1% less than September 2025.
-
$340,000 – Median price for residential homes, 1.2% less than September 2025.
-
196 – New home listings on the market, 6.2% less than September 2025.
-
723 – Active home listings on the market, 10.4% less than September 2025.
-
116 – Pending sales, 3.6% more than September 2025.
-
7.6 – Months of inventory, 0.9 months more than September 2025.
-
$40,861,500 – Total dollar volume of homes sold, 23.1% less than September 2025.
-
92.2% – Average close to list price, compared to 91.1% in September 2025.
September 2026 - For Lease
-
60 – Closed leases, 27.7% more than September 2025.
-
$1,997 – Median price for rent, 8.0% more than September 2025.
-
62 – New lease listings on the market, 3.1% less than September 2025.
-
90 – Active lease listings on the market, 18.9% less than September 2025.
-
63 – Pending sales, 53.7% more than September 2025.
-
1.7 – Months of inventory, 1.5 months less than September 2025.
-
$121,137 – Total dollar volume of leases, 39.2% more than September 2025.
-
97.5% – Average close to list price, compared to 95.8% in September 2025.
Caldwell County
September 2026 - For Sale
-
28 – Residential homes sold, 36.4% less than September 2025.
-
$301,500 – Median price for residential homes, 1.0% more than September 2025.
-
64 – New home listings on the market, 7.2% less than September 2025.
-
235 – Active home listings on the market, 33.5% more than September 2025.
-
47 – Pending sales, 80.8% more than September 2025.
-
6.4 – Months of inventory, 1.8 months more than September 2025.
-
$8,494,315 – Total dollar volume of homes sold, 40.0% less than September 2025.
-
92.1% – Average close to list price, compared to 90.9% in September 2025.
September 2026 - For Lease
-
22 – Closed leases, flat compared to September 2025.
-
$1,650 – Median price for rent, 1.5% more than September 2025.
-
18 – New lease listings on the market, 33.3% less than September 2025.
-
33 – Active lease listings on the market, 5.7% less than September 2025.
-
21 – Pending sales, 22.2% less than September 2025.
-
2.4 – Months of inventory, 1.0 months more than September 2025.
-
$33,764 – Total dollar volume of leases, 3.9% less than September 2025.
-
96.0% – Average close to list price, compared to 96.3% in September 2025.
Recent Posts