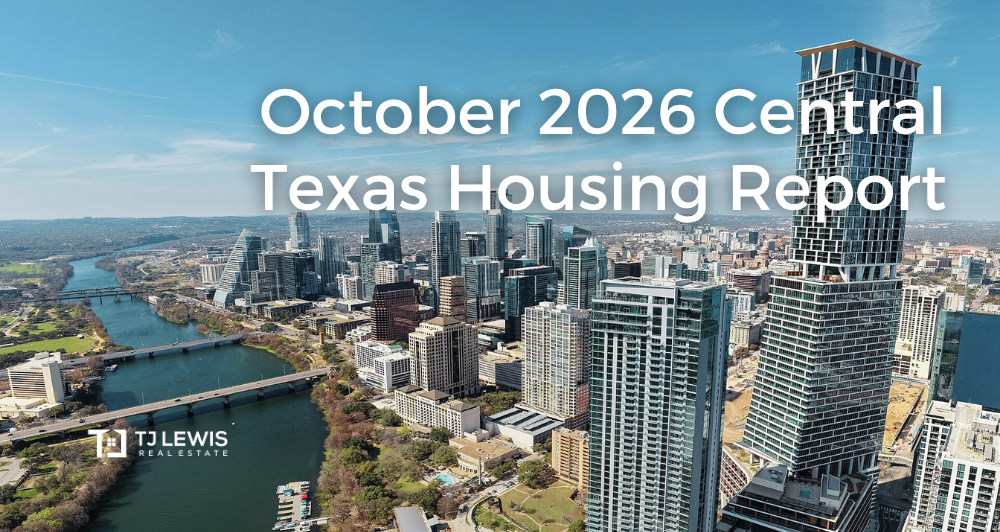
October 2026 Central Texas Housing Report
Central Texas Home Sales Decline in October as Buyers Navigate Affordability Challenges
The Central Texas housing market continued to feel the effects of affordability challenges in October, with fewer homes selling and the median sales price moving lower.
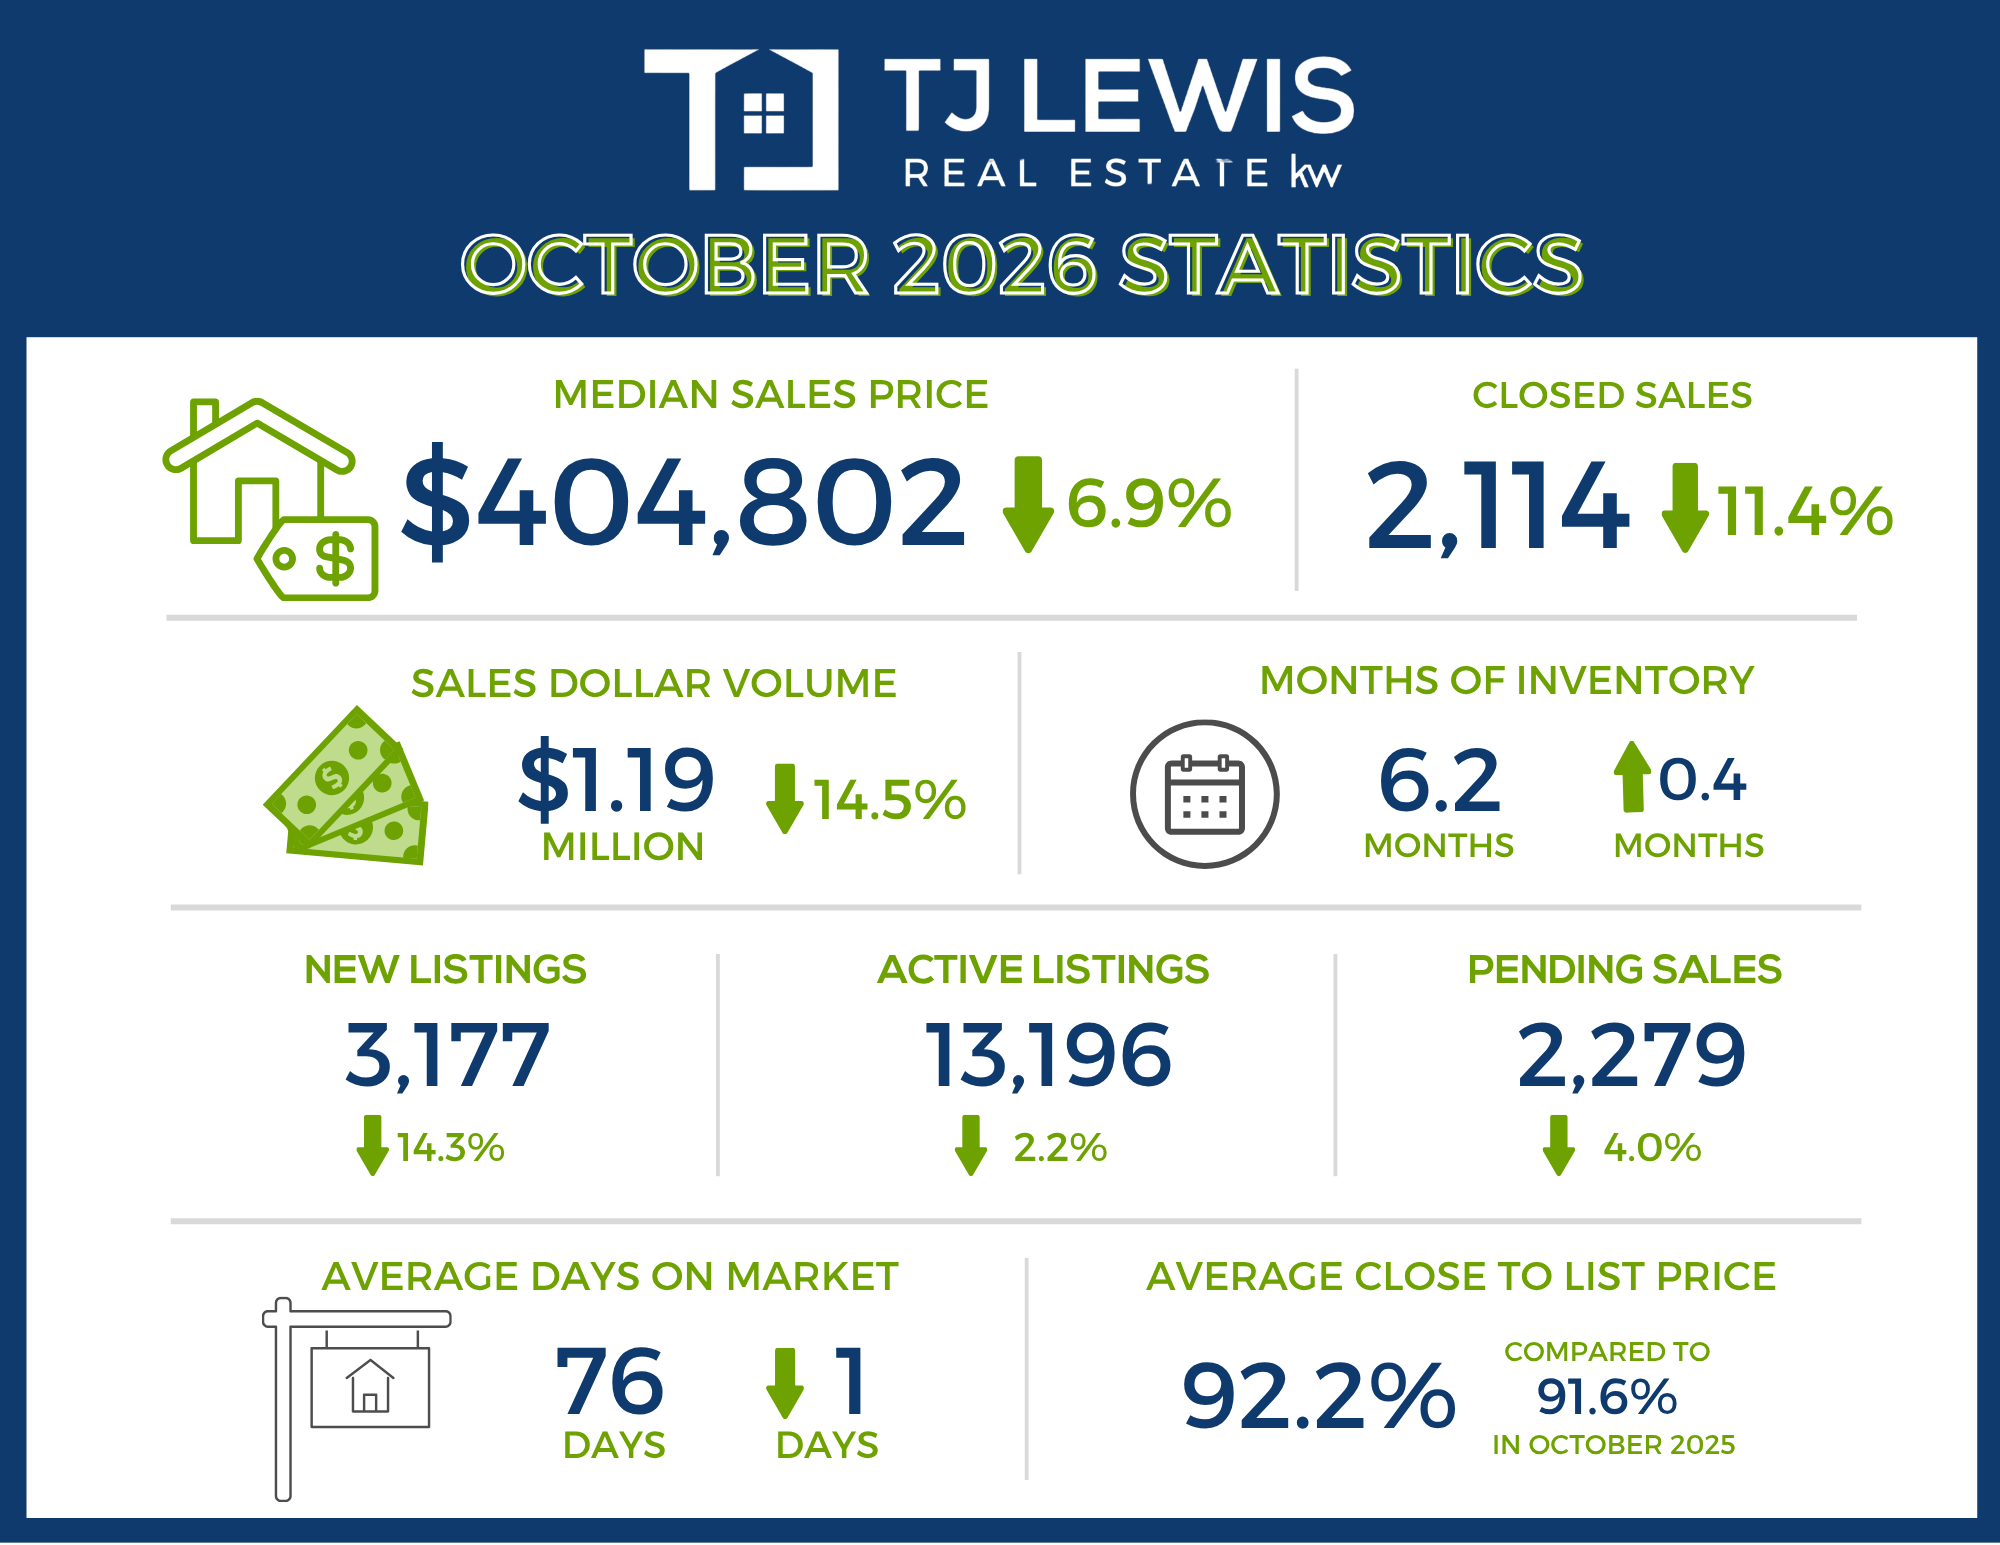
Closed sales across the Austin-Round Rock-San Marcos MSA declined 11.4% year over year to 2,114, while the median home sales price fell 6.9% to $404,802. However, the lower median price doesn't necessarily mean home values are dropping across the board. A greater share of sales came from lower-priced homes, with the strongest demand among properties priced between $200,000 and $299,000.
The takeaway is that buyers remain focused on affordability, and that is influencing which homes are attracting the most attention.
Resale Homes Are Becoming More Competitive
One of the more encouraging details in October's report is the growing activity in resale homes compared to new construction.
Vaike O'Grady, market research advisor at Unlock MLS, said affordability challenges continue to weigh on the Central Texas housing market, even as resale homes become more competitive with new construction.
“Despite another softer month, year-to-date home sales are up 2.5% compared with the same period last year, and while overall pending sales declined 4.0% year over year, pending resale contracts increased 6%. Builders have relied on incentives such as price reductions and mortgage rate buydowns to attract buyers, but that competitive advantage may be narrowing. This shift suggests resale activity is gaining traction as buyers continue to weigh affordability and value in their homebuying decisions.”
For a while, builders have had an advantage by offering incentives that help buyers manage their monthly payments. Now, resale homes are gaining traction, suggesting buyers are finding more value in the existing-home market.
What This Means for Buyers and Sellers
Lower prices and slower sales may give buyers more negotiating flexibility, but sellers need to recognize that competition remains strong. Pricing based on what the market supported a year or two ago may not be enough to attract today's buyers.
John Crowe, 2026 Unlock MLS and ABoR president, emphasized that softer home prices and slower sales may give buyers greater negotiating flexibility, while sellers must remain competitive with their pricing and expectations.
“The data is an important starting point, but understanding the factors behind the numbers is what helps buyers and sellers determine when the time is right for them. A professional agent can help buyers and sellers understand what's driving market trends, how conditions differ by county and what this all means for making their next move. Whether you're buying your first home, considering a move or preparing to sell, having someone who knows your local market inside and out can help you make decisions with greater clarity and confidence.”
October's numbers point to a market where value and strategy matter more than ever. Buyers may have more room to negotiate, while sellers who understand their competition and price accordingly can still find success.
The broader market provides useful context, but the right move depends on your neighborhood, your finances and your goals. The goal isn't to react to every market shift. It's to understand your options and make the decision that puts you in the best position.
Austin-Round Rock-San Marcos MSAOctober 2026 - For Sale
-
2,114 – Residential homes sold, 11.4% less than October 2025.
-
$404,802 – Median price for residential homes, 6.9% less than October 2025.
-
3,177 – New home listings on the market, 14.3% less than October 2025.
-
13,196 – Active home listings on the market, 2.2% less than October 2025.
-
2,279 – Pending sales, 4.0% less than October 2025.
-
6.2 – Months of inventory, 0.4 more than October 2025.
-
$1,192,154,266 – Total dollar volume of homes sold, 14.5% less than October 2025.
-
92.2% – Average close to list price, compared to 91.6% in October 2025.
October 2026 - For Lease
-
2,333 – Closed leases, 6.4% less than October 2025.
-
$2,100 – Median price for rent, 1.0% more than October 2025.
-
2,775 – New lease listings on the market, 10.0% less than October 2025.
-
4,187 – Active lease listings on the market, 29.0% less than October 2025.
-
2,483 – Pending sales, 0.9% more than October 2025.
-
2.3 – Months of inventory, 0.5 months less than October 2025.
-
$5,450,395 – Total dollar volume of leases, 5.9% less than October 2025.
-
95.5% – Average close to list price, compared to 94.1% in October 2025.
City of Austin
October 2026 - For Sale
-
704 – Residential homes sold, 14.6% less than October 2025.
-
$550,000 – Median price for residential homes, flat compared to October 2025.
-
1,091 – New home listings on the market, 19.4% less than October 2025.
-
4,400 – Active home listings on the market, 7.9% less than October 2025.
-
728 – Pending sales, 12.6% less than October 2025.
-
5.7 – Months of inventory, 0.2 less than October 2025.
-
$537,391,435 – Total dollar volume of homes sold, 17.7% less than October 2025.
-
92.0% – Average close to list price, compared to 91.7% in October 2025.
October 2026 - For Lease
-
1,226 – Closed leases, 4.8% less than October 2025.
-
$2,195 – Median price for rent, 0.2% less than October 2025.
-
1,480 – New lease listings on the market, 6.6% less than October 2025.
-
1,890 – Active lease listings on the market, 33.6% less than October 2025.
-
1,310 – Pending sales, 2.4% more than October 2025.
-
2.2 – Months of inventory, 0.7 months less than October 2025.
-
$3,049,400 – Total dollar volume of leases, 5.8% less than October 2025.
-
95.1% – Average close to list price, compared to 93.8% in October 2025.
Travis County
October 2026 - For Sale
-
958 – Residential homes sold, 13.2% less than October 2025.
-
$480,000 – Median price for residential homes, 4.9% less than October 2025.
-
1,523 – New home listings on the market, 16.1% less than October 2025.
-
6,202 – Active home listings on the market, 4.7% less than October 2025.
-
1,034 – Pending sales, 4.7% less than October 2025.
-
6.2 – Months of inventory, 0.2 months more than October 2025.
-
$674,001,551 – Total dollar volume of homes sold, 16.0% less than October 2025.
-
92.3% – Average close to list price, compared to 91.5% in October 2025.
October 2026 - For Lease
-
1,353 – Closed leases, 3.8% less than October 2025.
-
$2,100 – Median price for rent, 4.3% less than October 2025.
-
1,686 – New lease listings on the market, 6.4% less than October 2025.
-
2,332 – Active lease listings on the market, 30.5% less than October 2025.
-
1,452 – Pending sales, 2.8% more than October 2025.
-
2.2 – Months of inventory, 0.8 months less than October 2025.
-
$3,335,232 – Total dollar volume of leases, 5.3% less than October 2025.
-
95.1% – Average close to list price, compared to 93.9% in October 2025.
Williamson County
October 2026 - For Sale
-
720 – Residential homes sold, 12.8% less than October 2025.
-
$375,250 – Median price for residential homes, 9.2% less than October 2025.
-
990 – New home listings on the market, 14.7% less than October 2025.
-
4,135 – Active home listings on the market, 1.7% less than October 2025.
-
756 – Pending sales, 9.1% less than October 2025.
-
5.6 – Months of inventory, 0.4 months more than October 2025.
-
$324,588,121 – Total dollar volume of homes sold, 16.4% less than October 2025.
-
92.6% – Average close to list price, compared to 91.8% in October 2025.
October 2026 - For Lease
-
715 – Closed leases, 13.8% less than October 2025.
-
$2,100 – Median price for rent, 5.0% more than October 2025.
-
777 – New lease listings on the market, 17.5% less than October 2025.
-
1,293 – Active lease listings on the market, 30.0% less than October 2025.
-
738 – Pending sales, 6.5% less than October 2025.
-
2.4 – Months of inventory, 0.1 months less than October 2025.
-
$1,559,242 – Total dollar volume of leases, 9.9% less than October 2025.
-
96.4% – Average close to list price, compared to 94.3% in October 2025.
Hays County
October 2026 - For Sale
-
296 – Residential homes sold, 8.1% less than October 2025.
-
$371,080 – Median price for residential homes, 4.9% less than October 2025.
-
447 – New home listings on the market, 4.5% less than October 2025.
-
1,916 – Active home listings on the market, 7.5% more than October 2025.
-
354 – Pending sales, 10.6% more than October 2025.
-
6.9 – Months of inventory, 1.3 months more than October 2025.
-
$144,266,338 – Total dollar volume of homes sold, 9.0% less than October 2025.
-
92.2% – Average close to list price, compared to 92.5% in October 2025.
October 2026 - For Lease
-
183 – Closed leases, 5.7% less than October 2025.
-
$1,995 – Median price for rent, 2.3% more than October 2025.
-
222 – New lease listings on the market, 7.1% less than October 2025.
-
441 – Active lease listings on the market, 16.9% less than October 2025.
-
204 – Pending sales, 4.6% more than October 2025.
-
2.6 – Months of inventory, 0.1 months less than October 2025.
-
$405,651 – Total dollar volume of leases, 5.0% less than October 2025.
-
94.9% – Average close to list price, compared to 94.4% in October 2025.
Bastrop County
October 2026 - For Sale
-
93 – Residential homes sold, 15.5% less than October 2025.
-
$348,500 – Median price for residential homes, 7.5% more than October 2025.
-
148 – New home listings on the market, 17.3% less than October 2025.
-
709 – Active home listings on the market, 9.2% less than October 2025.
-
86 – Pending sales, 21.1% less than October 2025.
-
7.8 – Months of inventory, 0.6 months less than October 2025.
-
$34,664,179 – Total dollar volume of homes sold, 11.9% less than October 2025.
-
90.4% – Average close to list price, compared to 89.3% in October 2025.
October 2026 - For Lease
-
65 – Closed leases, 58.5% more than October 2025.
-
$1,900 – Median price for rent, flat compared to October 2025.
-
66 – New lease listings on the market, 1.5% less than October 2025.
-
83 – Active lease listings on the market, 26.5% less than October 2025.
-
71 – Pending sales, 42.0% more than October 2025.
-
1.7 – Months of inventory, 1.8 months less than October 2025.
-
$125,630 – Total dollar volume of leases, 59.7% more than October 2025.
-
97.1% – Average close to list price, compared to 94.9% in October 2025.
Caldwell County
October 2026 - For Sale
-
47 – Residential homes sold, 95.8% more than October 2025.
-
$280,000 – Median price for residential homes, 5.7% more than October 2025.
-
69 – New home listings on the market, 18.8% less than October 2025.
-
234 – Active home listings on the market, 11.4% more than October 2025.
-
49 – Pending sales, 69.0% more than October 2025.
-
10.2 – Months of inventory, 1.5 months less than October 2025.
-
$14,634,077 – Total dollar volume of homes sold, 110.6% more than October 2025.
-
89.6% – Average close to list price, compared to 90.4% in October 2025.
October 2026 - For Lease
-
17 – Closed leases, 19.0% less than October 2025.
-
$1,250 – Median price for rent, 16.7% less than October 2025.
-
24 – New lease listings on the market, 27.3% less than October 2025.
-
38 – Active lease listings on the market, 22.4% less than October 2025.
-
18 – Pending sales, 20.0% more than October 2025.
-
2.7 – Months of inventory, 0.8 months less than October 2025.
-
$24,640 – Total dollar volume of leases, 24.6% less than October 2025.
-
95.7% – Average close to list price, compared to 97.6% in October 2025.
Recent Posts